Polkadot (DOT/USDT) Seeks Support Near a Critical $6.592 Level
Estimated Reading Time: 3 minutes
Don’t invest unless you’re prepared to lose all the money you invest. This is a high-risk investment and you are unlikely to be protected if something goes wrong. Take 2 minutes to learn more
Polkadot Long-term Analysis: Bearish
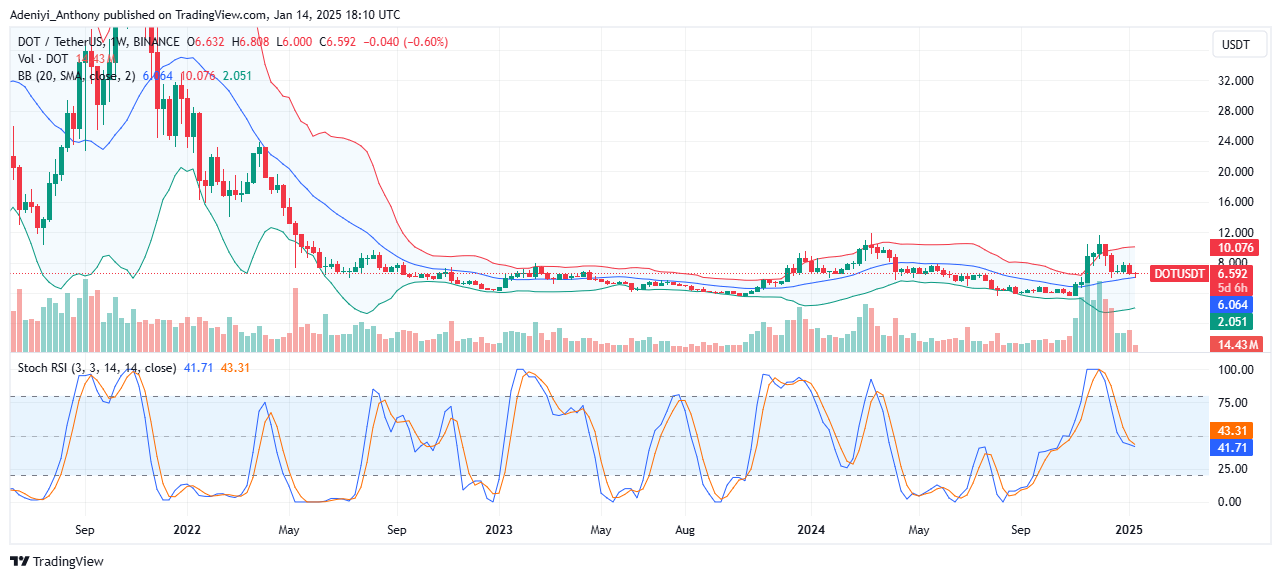
The performance of Polkadot against the Tether seems to be waiting for a catalyst, as the price oscillates near the dynamic 20-period moving average of the Bollinger Bands. However, recent price action suggests the pair has encountered resistance around the $10.000 level while maintaining a holding above the $6.000 level. This reflects cautious optimism in the long run.
Expectations remain hinged on potential action around the mid-band of the Bollinger bands, as the Stochastic RSI position moves to the south.
Currently, Polkadot trades at $6.592 with 14.43 million weekly traded volumes.
Technical Indicators
Major Resistance Levels: $8.500, $10.076, and $12.000
Major Support Levels: $6.064, $5.000, and $4.000
Polkadot Technical Analysis
On a weekly timeframe, Polkadot against the Tether seems to be consolidating after a recent short upside movement, but the momentum appears to be neutral as the market awaits a catalyst to determine the pair’s next direction.
The current expansion of the Bollinger bands suggests an impending spike in volume. However, if the pair breaks above the $5.500, a sustained move towards the $12.000 may be guaranteed. Conversely, a break below the $6.064 support level might trigger a re-test of the $5.000 level as the oscillator’s lines point to the south.
DOT/USDT Analysis: Expectations
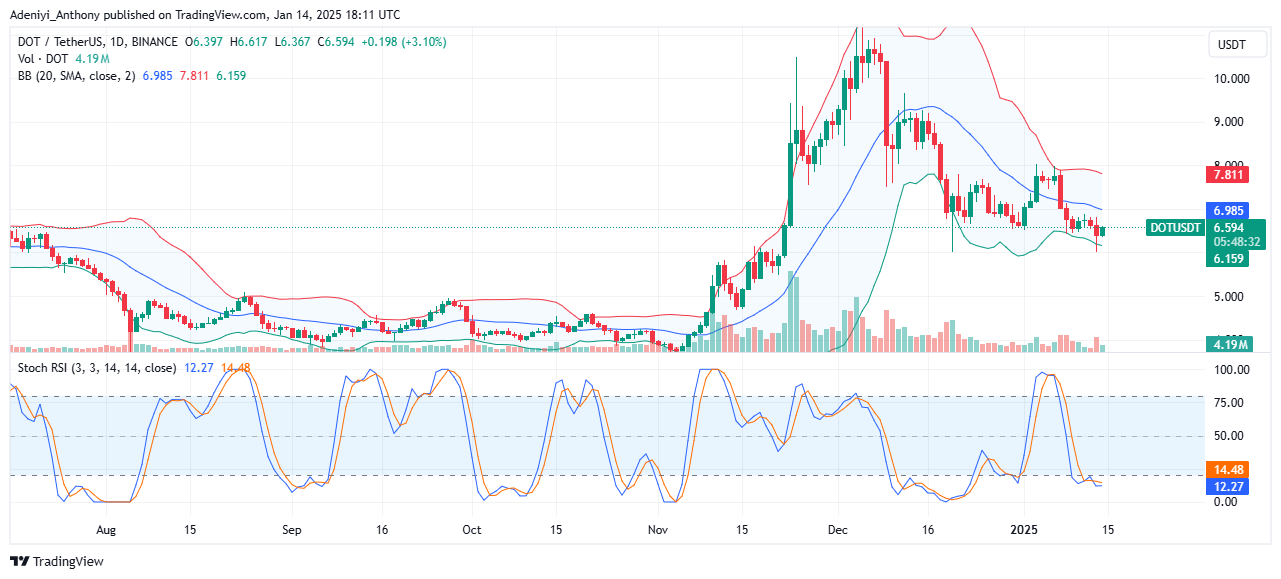
On the daily chart, DOT/USDT is up by 3.10 % with price trading between the lower section of the Bollinger bands. However, the bands seem to be contracting suggesting reduced volatility in the near term and potential accumulation in the short term despite the increase in trading figures above the previous candle.
On the other hand, the Stochastic RSI a potential reversal moves provided momentum builds, as the indicator’s lines operate below the 20-mark level.
To this end, if the price holds above the $6.159 level, it may retest resistance at $7.000 or higher; otherwise, failure to maintain this level could lead to further declines toward $5.000.
You can purchase crypto coins here. Buy LBlock