DeFi Coin Price Prediction: DEFC/USD Consolidates to Shoot Upward
Estimated Reading Time: 2 minutes
Don’t invest unless you’re prepared to lose all the money you invest. This is a high-risk investment and you are unlikely to be protected if something goes wrong. Take 2 minutes to learn more
DeFi Coin Price Prediction – October 16
The DeFi Coin price prediction shows that DEFC is facing moderate volatility before heading to the upside.
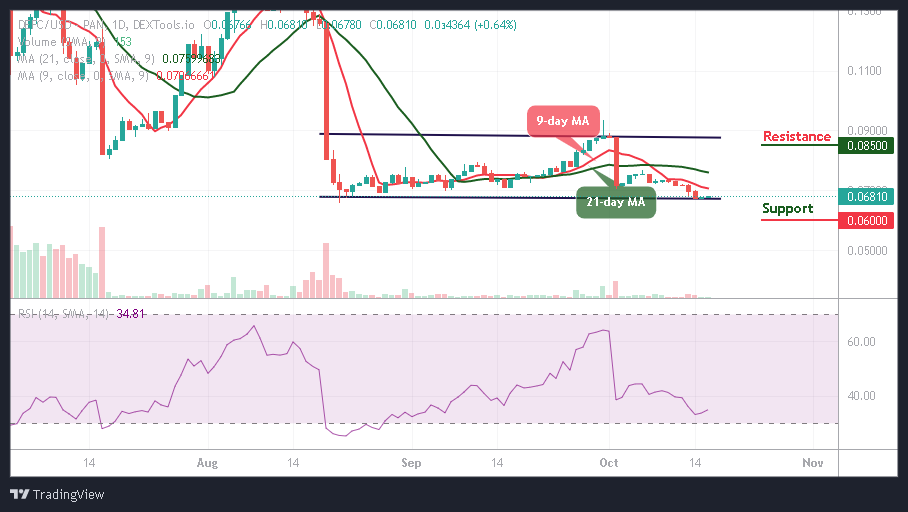
DEFC/USD Long-term Trend: Ranging (1D Chart)
Key Levels:
Resistance levels: $0.085, $0.090, $0.095
Support levels: $0.060, $0.055, $0.050
DEFC/USD is trading around the $0.068 level below the 9-day and 21-day moving averages. As the coin consolidates within the channel, the closest support could be located below the lower boundary of the channel. Meanwhile, if the bullish movement increases, the nearest resistance level of $0.070 could be found.
DeFi Coin Price Prediction: DEFC Price Will Face the Upside
The DeFi Coin price will begin to create bullish trends once the sideways movement fades away, and this is noticeable for the technical indicator Relative Strength Index (14) as the signal line moves to cross above the 40-level.
At the time of writing, the DeFi Coin is moving moderately within the channel, but if the coin decides to cross below the channel, it could touch the nearest support level of $0.065. However, any further bearish movement can hit the supports at $0.060, $0.055, and $0.050, while the resistance levels can be located at $0.085, $0.090, and $0.095 respectively.
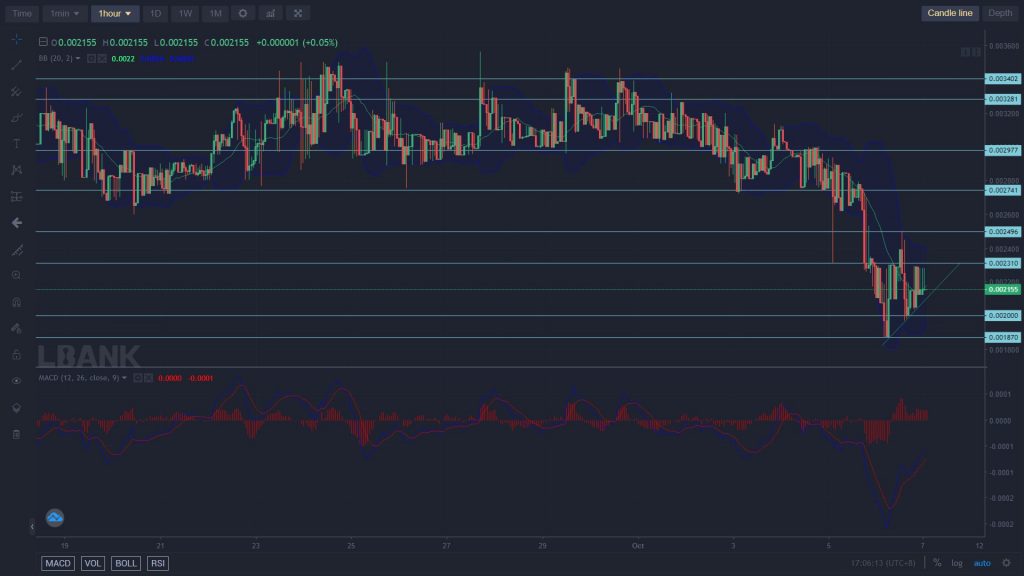
DEFC/USD Medium-term Trend: Ranging (4H Chart)
The DeFi Coin continues to hover within the 9-day and 21-day moving averages. However, the nearest resistance could be found at around $0.070. Meanwhile, if the DEFC price crosses below the 9-day moving average and heads toward the lower boundary of the channel, DEFC/USD can create a critical support level at $0.065 and below.
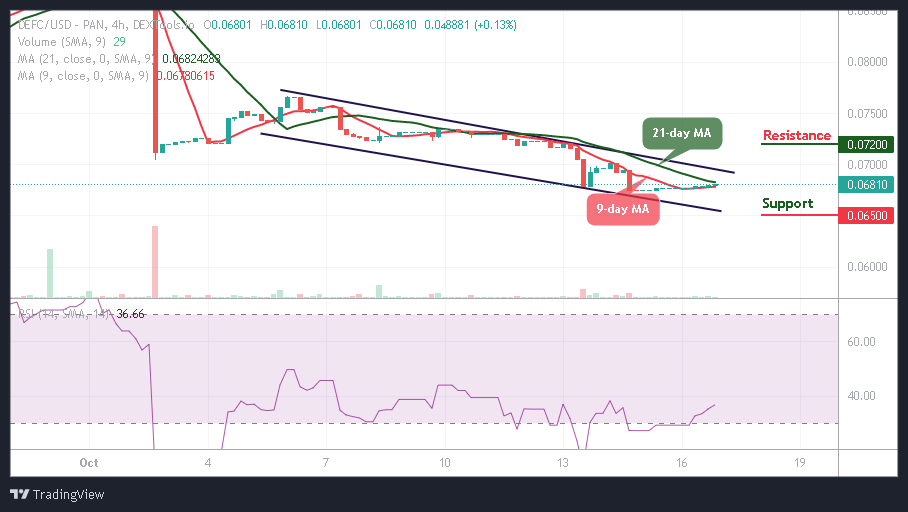
Meanwhile, any bullish movement above the upper boundary of the channel will allow the coin to begin a new uptrend, and this could reach the potential resistance level at $0.072 and above as the technical indicator Relative Strength Index (14) moves to cross above the 40-level.
You can purchase DeFi Coin here. Buy DEFC