Litecoin Price Prediction: LTC/USDT Falls to a Strong Support
Estimated Reading Time: 3 minutes
Don’t invest unless you’re prepared to lose all the money you invest. This is a high-risk investment and you are unlikely to be protected if something goes wrong. Take 2 minutes to learn more

Litecoin Price Prediction (December 24):
Price activity in the Litecoin daily market had corrected downwards very sharply in recent sessions. This saw the market crash from well above the $120 price level to test the support at the $100 mark. From the look of things, the mentioned support seems strong as the market traded above that mark afterward.
LTC/USDT Long-Term Trend: Bearish (Daily Chart)
Key Price Levels:
Resistance: $110.00, $120.00, $130.00
Support: $100.00, $90.00, $80.00
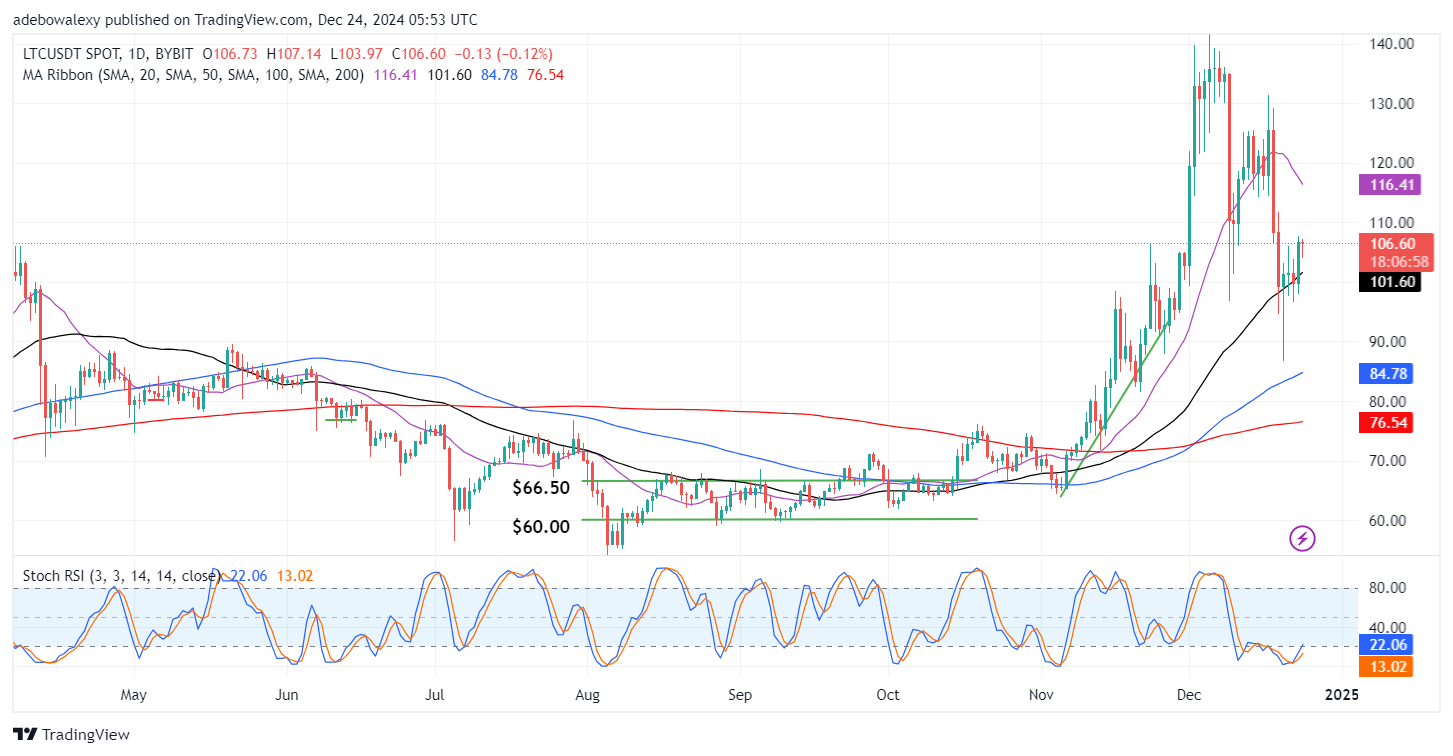
Price action rebounded strongly upward in the previous session. As a result, the ongoing session has appeared as a red hammer price candle. Be that as it may, Litecoin continues to trade at a considerable distance above the 50-day MA line. In addition, the Stochastic RSI lines are still rising out of the oversold region with the lead line now above the 20 level of the indicator.
Litecoin Price Prediction: LTC/USDT Upside Forces Stay Largely Ahead
Price activity in the Litecoin daily market has unequivocally communicated that the $100.00 price level is a strong baseline. Also, it could be perceived that upside forces are still active in the market. The size of the corresponding price candle to the previous session reveals this, as well as the upwardly contracted body of the last price candle on the chart.
In addition, price action here lies above most of the MA lines, and the Stochastic RSI lines are now very high in the overbought region. All these affirm the possibility of prices progressing upwards. Therefore, traders may still want to stay aligned with the trend.
Litecoin Price Prediction: LTC/USDT Bulls Are Still Finding Footing (4-Hour Chart)
Coming to the LTC 4-hour price chart, one can see that upside forces are still influencing price movements. The last price candle on the chart appeared green following the red of the previous session. Also, the RSI indicator lines are still in the oversold region, but the lead line has a deflection on it.
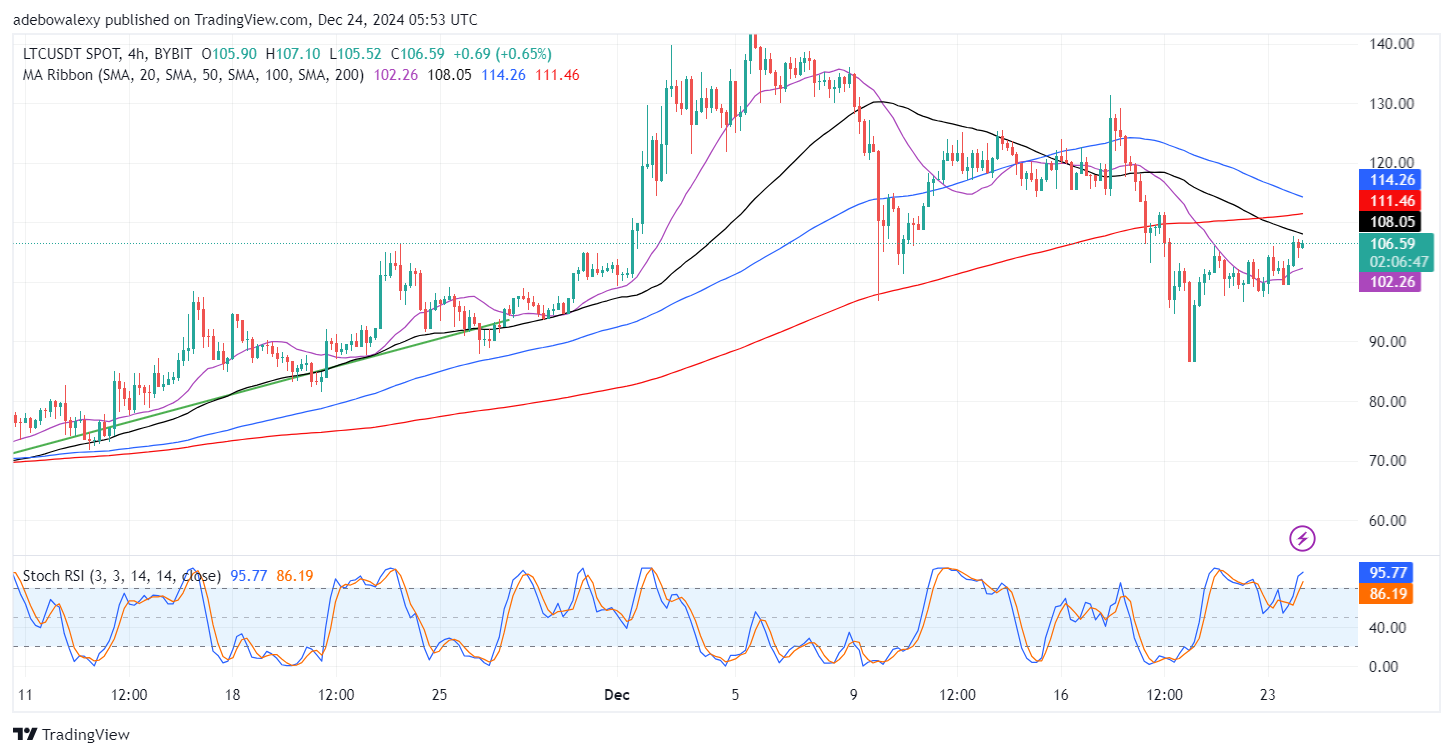
Indications arising from this price chart seem to point more favorably in the direction of buyers. Because the RSI lines are in the overbought region, coupled with the fact that the last price candle is green and approaching the 50-day MA, hints at the fact that this market may progress upward at least toward or through the $110 price level.