Dogecoin Price Prediction: DOGE/USDT Consolidates, as Price Action Lacks Direction
Estimated Reading Time: 3 minutes
Don’t invest unless you’re prepared to lose all the money you invest. This is a high-risk investment and you are unlikely to be protected if something goes wrong. Take 2 minutes to learn more

Dogecoin Price Prediction (December 23):
The Dogecoin market has seen a strong bearish correction over the past sessions. As a result, the token’s price action has fallen through multiple technical supports. However, now, the market can be seen consolidating just above another one as it appears that bears are losing momentum.
DOGE/USDT Long-Term Trend: Bearish (Daily Chart)
Key Price Levels:
Resistance: $0.3500, $0.4000, $0.4500
Support: $0.3000, $0.2500, $0.2000
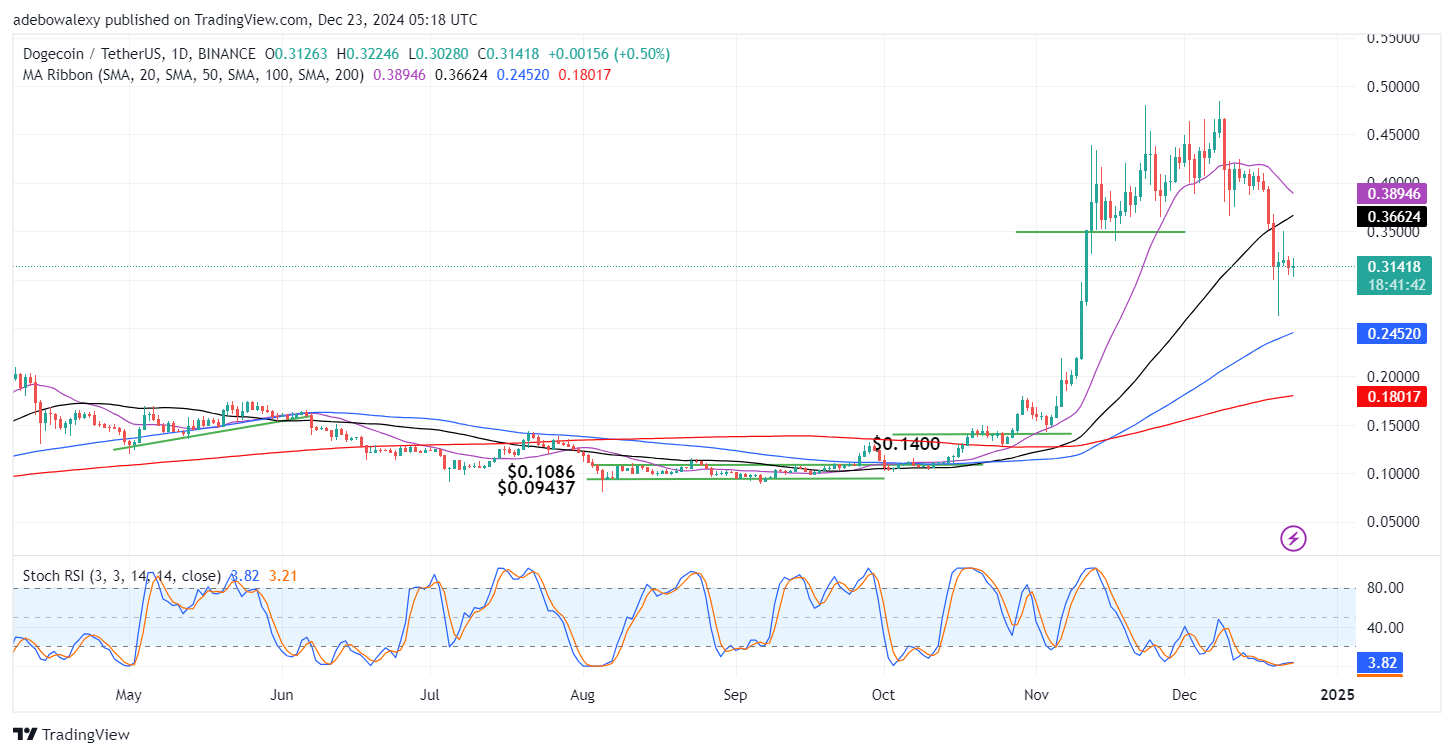
Since the past four sessions when price action tested the support at the $0.3000 price level, price action has continued to trend sideways. The last price candle on the chart is green but lies below the 20 and 50-day Moving Average (MA) lines. Similarly, the Stochastic Relative Strength Index lines are in the oversold region of the indicator with the lines of the indicator slightly lifted upwards.
Dogecoin Price Prediction: DOGE/USDT Buyers Aren’t Strongly Convinced
Ever since the downward correction in the Dogecoin daily market breached the $0.3000 support level, price activity in this market has been trending sideways. The last price candle on the chart is green but has a small body, indicating that buyers aren’t having considerable strength.
Also, price action lies at a significant distance below the 20- and 50-day MA lines. In addition, the Stochastic RSI lines can be seen appearing largely depressed in the oversold zone of the indicator. Consequently, traders in this market may want to rely more on fundamentals about the crypto market as well as the coin in question.
Dogecoin Price Prediction: DOGE/USDT Lurks Around the 20-day MA (4-Hour Chart)
By extending Dogecoin’s price analysis to a 4-hour market, it could be seen that price action has been lurking just around the 20-day MA line. This MA line lies below all other MA lines on this price chart. Meanwhile, the Stochastic RSI lines can be seen appearing convergent just around the 40 mark of the indicator.
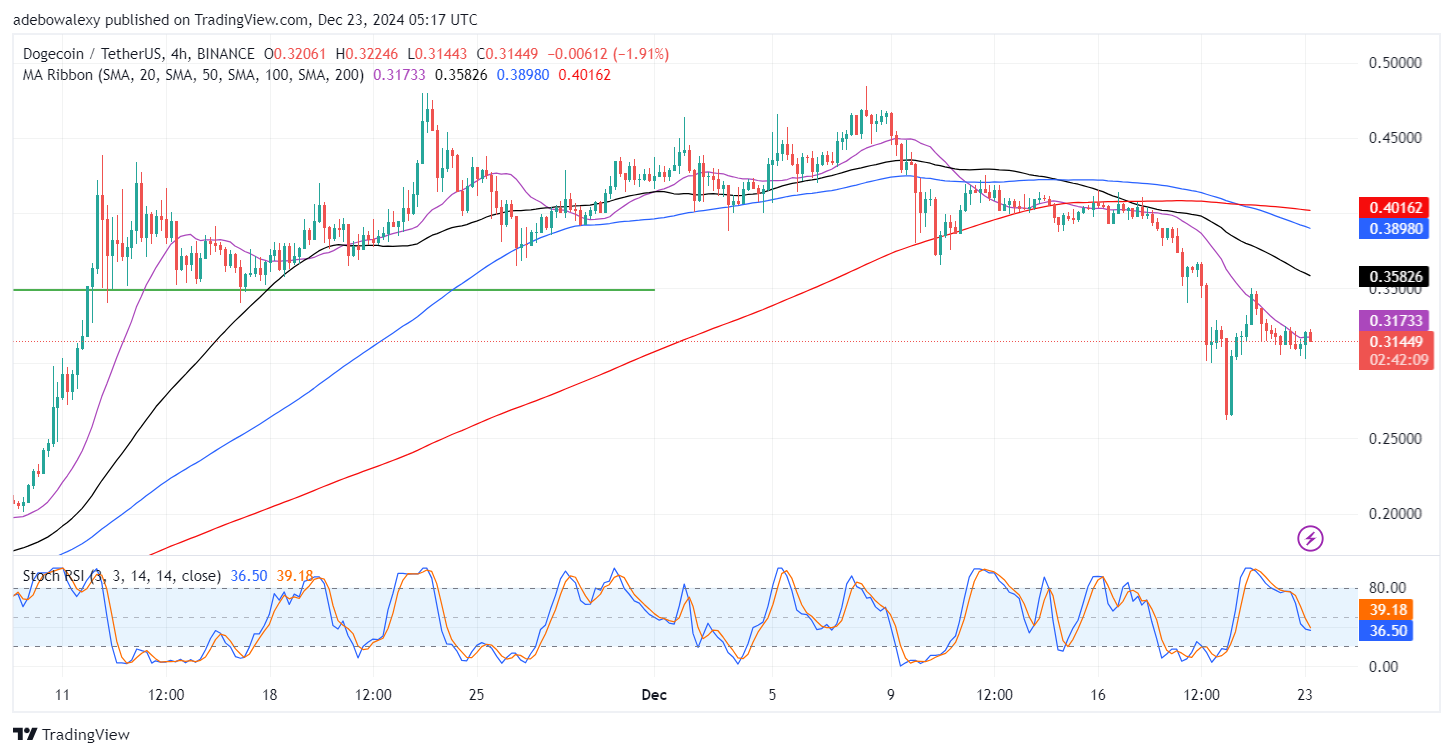
This is happening at a time when the last price candle has appeared red. Technically, indications arising from this market seem mixed. However, the appearance of the corresponding price candle to the ongoing session suggests that the downward retracement may continue at least toward the $0.3000 technical support level.