Litecoin (LTC/USD) Price Features, Rallying in Smaller Bullish Channels
Estimated Reading Time: 3 minutes
Don’t invest unless you’re prepared to lose all the money you invest. This is a high-risk investment and you are unlikely to be protected if something goes wrong. Take 2 minutes to learn more

Free Crypto Signals Channel
Litecoin Price Prediction – April 5
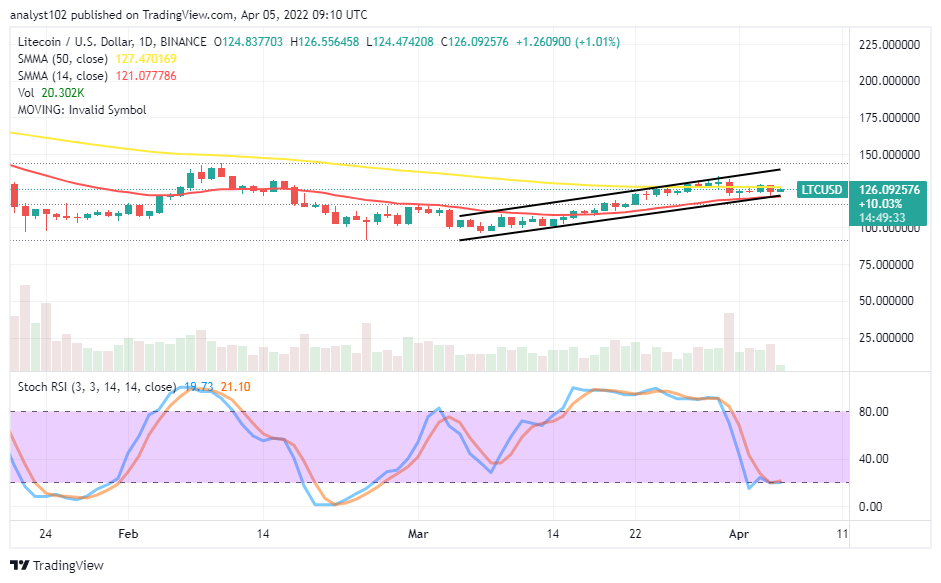
It has occurred that the LTC/USD market price holds, rallying in smaller bullish channels, trading between $126 and $124 high and low values, respectively. The crypto keeps a positive percentage rate of 1.01 against the purchasing worth of the US Dollar.
LTC/USD Market
Key Levels:
Resistance levels: $135, $145, $155
Support levels: $120, $110, $100
LTC/USD – Daily Chart
The LTC/USD daily chart showcases the crypto-economic price features, rallying in smaller bullish channels. The market hovers closer to the lower bullish channel trend line. The 14-day SMA indicator joins the lower bullish channel trend line at the end near underneath the 50-day indicator within the space of the channels. The Stochastic Oscillators have traveled southbound to position around the range of 20. And they have closed their lines around it.
What method can the LTC/USD market run into a visible declining trading outlook as the crypto-economic price features, rallying in smaller bullish channels?
The LTC/USD market can run into a visible declining trading outlook by consolidating its efforts around the lower spot of the lower bullish channel trend line and the 14-day SMA combined. And that should result in a breakdown of them for confirmation of a downward force returning afterward. On the contrary, if the situation eventually reproduces a rebound around $120, bulls will push the crypto economy to a higher resistance level around the upper bullish trend line.
On the downside of the technical analysis, the LTC/USD market bears have to hold stances firmly beneath the level of $135 resistance. The force trait to the downside, the US currency doesn’t have the much-required catalyst to push more downs from a technical point of view. However, if bears tend to consolidate their stances around $125, more downs will achieve.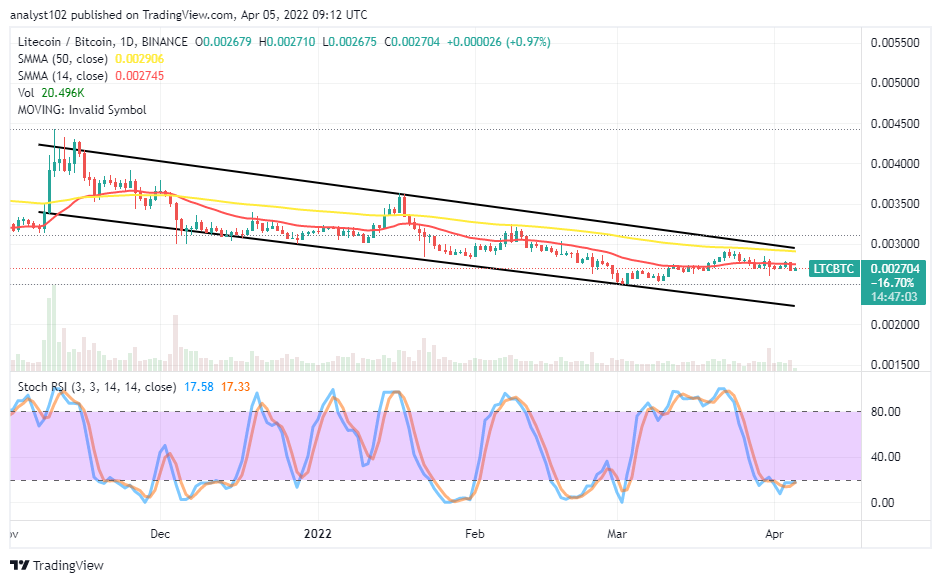 LTC/BTC Price Analysis
In comparison, Litecoin has continued to feature a loss of weight against Bitcoin around the smaller SMA trend line. The 50-day SMA indicator is above the 14-day SMA indicator with the bearish channel trend lines. The Stochastic Oscillators have moved southbound slightly against the range of 20 into the oversold region. And they attempt to move in a consolidation manner. That signifies the base crypto economy may still, to some extent, hold downward below the smaller trend line for a while.
Note: Cryptosignals.org is not a financial advisor. Do your research before investing your funds in any financial asset or presented product or event. We are not responsible for your investing results.
You can purchase Lucky Block here. Buy LBlock: