Dogecoin (DOGE/USD) Trade Extends Retracement Toward $0.080
Estimated Reading Time: 3 minutes
Don’t invest unless you’re prepared to lose all the money you invest. This is a high-risk investment and you are unlikely to be protected if something goes wrong. Take 2 minutes to learn more
Dogecoin Price Prediction – December 12
Over time, there has been a loss of momentum-garnering situation in the DOGE/USD market operations as the crypto trade extends retracement toward the $0.080 support line. With a sign of negativity, the price is kept at 3.88 percent, trading around $0.0892.
DOGE/USD Market
Key Levels:
Resistance levels: $0.11, $0.12, $0.13
Support levels: $0.080, $0.070, $0.060
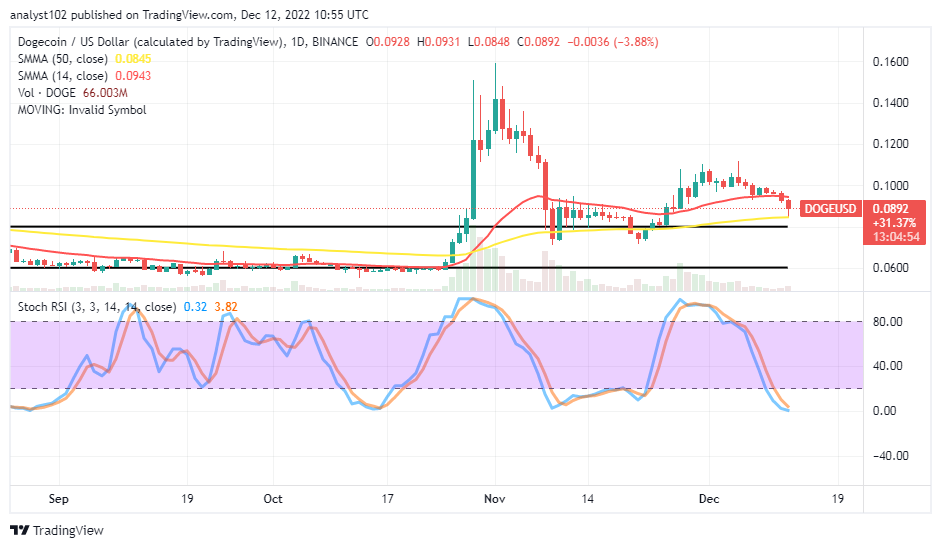
DOGE/USD – Daily Chart
The DOGE/USD daily chart reveals that the crypto trade extends retracement toward the $0.080 support level, representing the previous upper range zone. The 14-day SMA trend line is at $0.0943 above the $0.0845 value line of the 50-day SMA trend line. And they are above the trading SMA indicators. The Stochastic Oscillators have dipped into the oversold region to maintain 3.82 and 0.32 levels. That signifies that selling activities may have pushed close to a baseline spot where the price can bounce up in no time.
Will the DOGE/USD market drop southward beyond the $0.080 upper range line?
As of the writing, the DOGE/USD market operation is trying to drop closely below the former upper range of $0.080 as the crypto trade extends retracement toward the value line. There has been no bullish trading candlestick to suggest the possibility of the price recouping the required momentum to swing back upward. Based on that supposition, purchasers will hold out until a bullish candlestick appears.
On the negative side of the technical analysis, the velocity of the price pressures to the downside has somewhat drastically reduced to the bearest capacity, s indicated by the reading of the Stochastic Oscillators. Sellers may now have to intensify efforts to consolidate their positions toward moving to break past the $0.080 support level. However, the trading scenario may not allow decency in getting a shorting entry.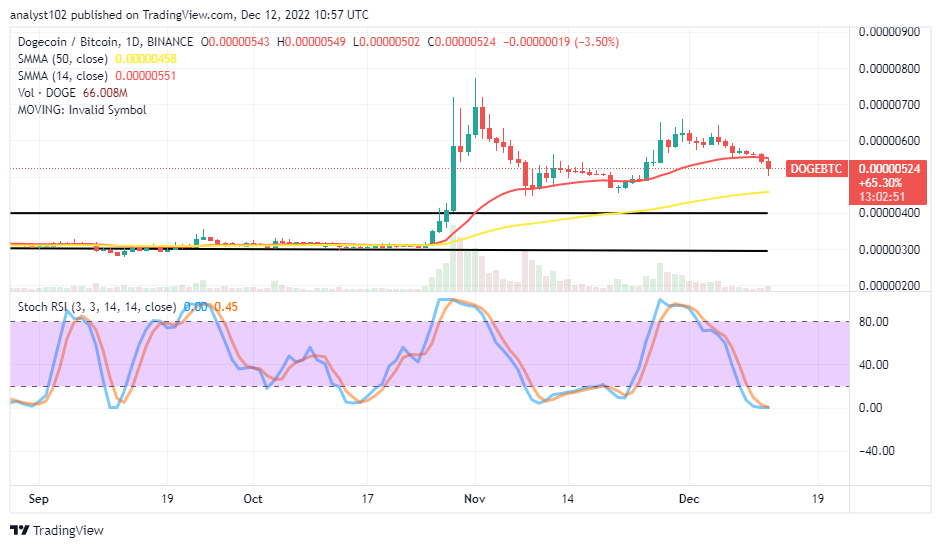
DOGE/BTC Price Analysis
In comparison, Dogecoin is succumbing to a force inflicted on the market by the trending outlook of Bitcoin around the trend line of the smaller SMA. As it is, the pairing cryptocurrency trade extends retracement toward the bigger SMA trend line. The 14-day SMA indicator is over the 50-day SMA indicator. The Stochastic Oscillators have move southbound into the oversold region to 0.45 and 0.00 levels. That signifies the possibility that the base crypto may resist been debasing against the counter-trading crypto.
Note: Cryptosignals.org is not a financial advisor. Do your research before investing your funds in any financial asset or presented product or event. We are not responsible for your investing results.
You can purchase Lucky Block here. Buy LBLOCK