POL (ex-MATIC) Price Prediction: POL/USDT Upside Retracement Extends
Estimated Reading Time: 3 minutes
Don’t invest unless you’re prepared to lose all the money you invest. This is a high-risk investment and you are unlikely to be protected if something goes wrong. Take 2 minutes to learn more

POL (ex-MATIC) Price Prediction (December 21):
Upside forces in the POL (ex-MATIC) daily market regained control of price movement just above the $0.4000 price level. The market rebounded strongly upward, such that the subsequent session brought the token to now trade above the $0.5000 price level.
POL/USDT Long-Term Trend: Bearish (Daily Chart)
Key Price Levels:
Resistance: $0.60, $0.70, $0.80
Support: $0.45, $0.40, $0.35
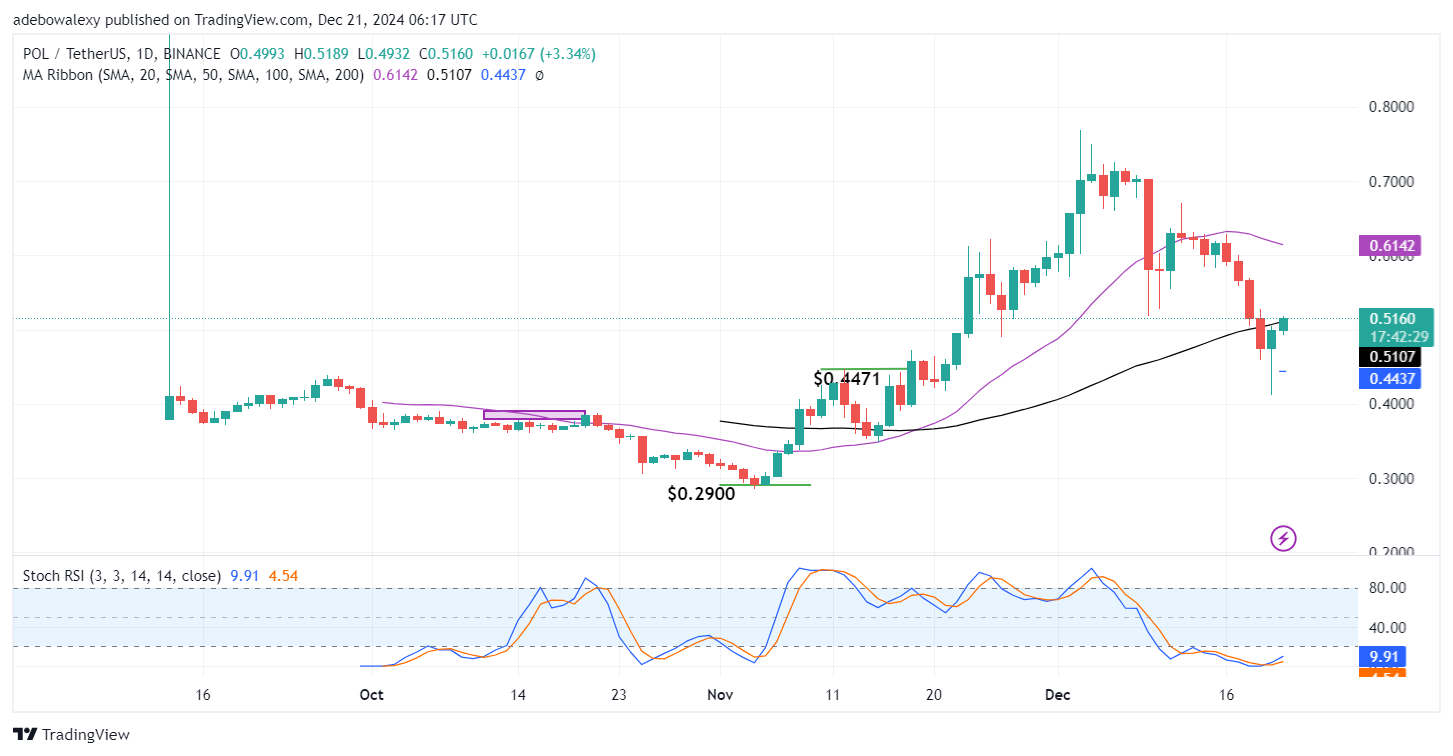
Yes, it is as stated above that the POL (ex-MATIC) token now trades above the $0.5000 threshold. As can be seen, the last price candle on the chart now sits just at the $0.5000 mark as it appears green. Likewise, the mentioned price candle now places the price of the token above the 50-day Moving Average (MA) lines. Also, the Stochastic Relative Strength Index (RSI) lines can be seen rising steadily out of the oversold region.
POL (ex-MATIC) Price Prediction: POL/USDT Bull March Upwards
POL (ex-MATIC)’s price has risen past a technical price level of $0.5000 threshold level. With the ongoing session now sitting just above the mentioned psychological support level. As a result, price activity has risen through one of the two appearing MA curves on the chart. This seems promising as buying confidence may increase, causing the market to rise further.
In addition, the upwards-rising lines of the Stochastic RSI lines also suggest that upside forces are gaining momentum. This appears consistent with the opinion that price action will likely progress upward in subsequent sessions.
POL (ex-MATIC) Price Prediction: POL/USDT Positions for More Tailwind (4-Hour Chart)
Price activity in the ex-MATIC 4-hour market has a notable resemblance to price action on the daily market. The last price candle here has also risen past the 50-day MA line. Here, price action seems to have come a long way with the Stochastic RSI lines now highly in the overbought region. The lines of the indicator have converged but maintain an upward trajectory. The last price candle has now just poked through the 50-day MA line.
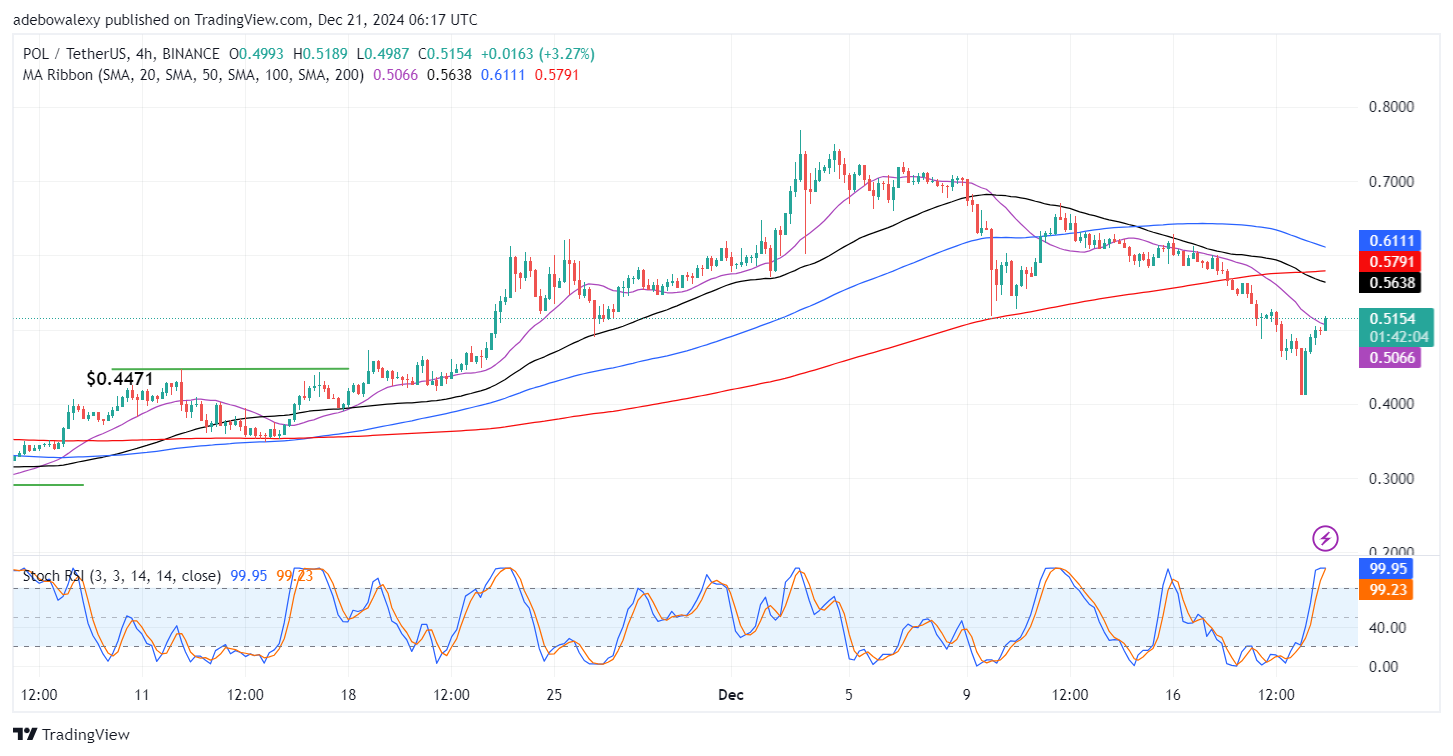
At this point, the Stochastic RSI lines seem overstretched but the trajectory of the indicator lines suggests that the market may proceed upwards as the RSI lines prepare to drag sideways at the 100 mark. Therefore, traders can hope that upside forces persist until the market finds support above the 50-day MA curve, as this may cause the market to proceed toward the $0.5600 price level.
Get POL (ex-MATIC) here. Buy POL