Solana (SOL) Price Prediction: SOL/USDT Eyes Support of Over One Month
Estimated Reading Time: 3 minutes
Don’t invest unless you’re prepared to lose all the money you invest. This is a high-risk investment and you are unlikely to be protected if something goes wrong. Take 2 minutes to learn more

Solana Price Prediction (December 20):
The Solana market has been retracing sharply downward. This downward retracement has spanned three sessions now. As a result, the market has fallen below more key technical landmarks as the market now eyes a very important support level.
SOL/USDT Long-Term Trend: Bearish (Daily Chart)
Key Price Levels:
Resistance: $200, $220, $240
Support: $190, $170, $150
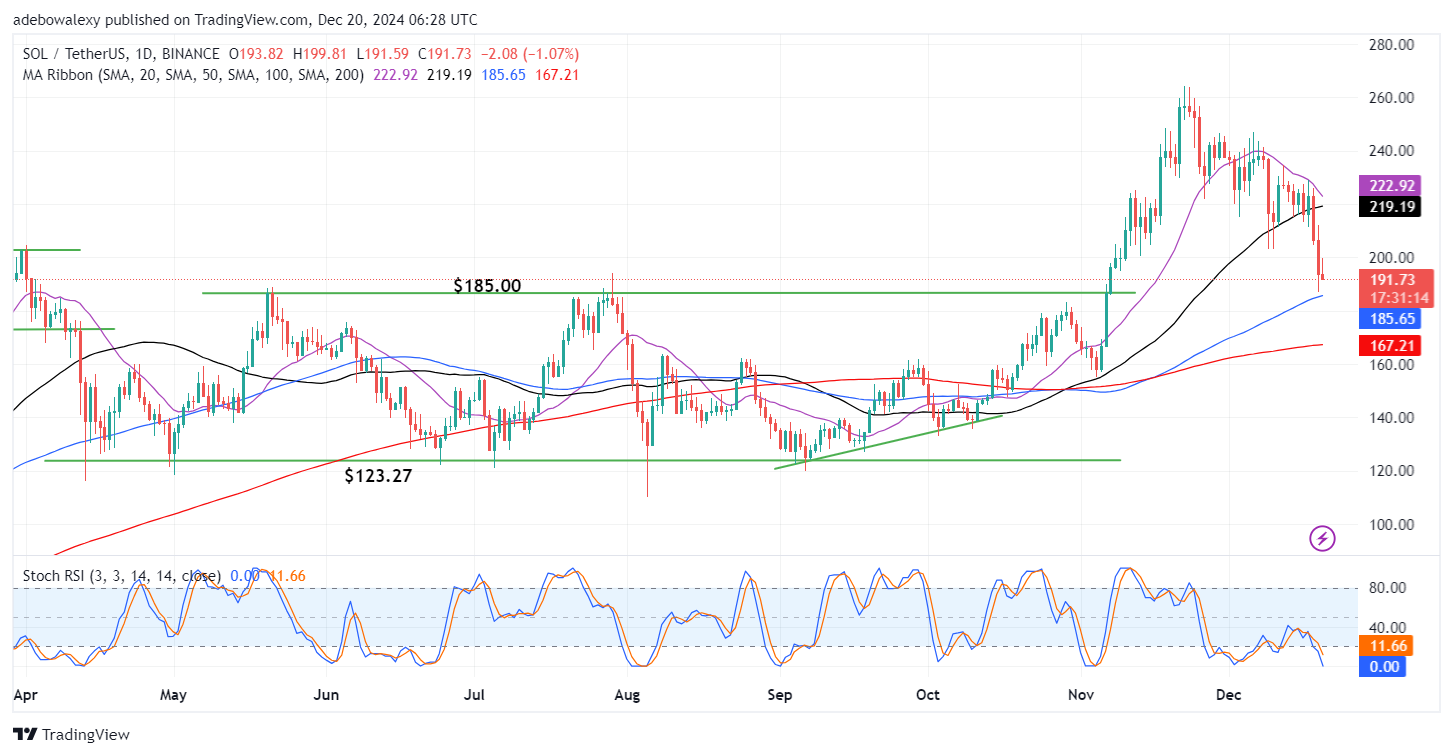
Price activity in the Solana market fell below the $200 support level in the previous session. The ongoing session remains on the same track but has produced a much smaller downward retracement. The market now hovers just above the support level at the $185.00 threshold. Consequently, the more recent price candle lies below the 20- and 50-day Moving Average curves. In addition, the Stochastic Relative Strength Index (RSI) lines are also falling sharply into the oversold region of the indicator.
Solana Price Prediction: SOL/USDT Bears Slow Down
Solana’s price action has been under strong headwinds for the past two sessions. As can be seen, price action retraced to lower price levels very strongly during the past two sessions. As a result, price action now lies below the 20- and 50-day MA curves. Also, the Stochastic RSI lines continue to descend into the oversold region of the indicator.
However, the last price candle, corresponding to the ongoing session, can be seen appearing red but seems to have produced a lesser downward retracement than that of the previous two sessions. The corresponding price candle has appeared as an inverted hammer, which suggests a possible trend reversal in this market.
Solana Price Prediction: SOL/USDT Oscillates Just Below the $200 Threshold (4-Hour Chart)
Following price action’s dip below the $200 price level, the market has been oscillating between the $190 and $200 price levels. However, the ongoing session has delivered a moderate downward retracement in the Solana 4-hour market. Also, here, price action now lies below all the MA curves. Meanwhile, the Stochastic RSI lines still have an upward trajectory in the oversold region.
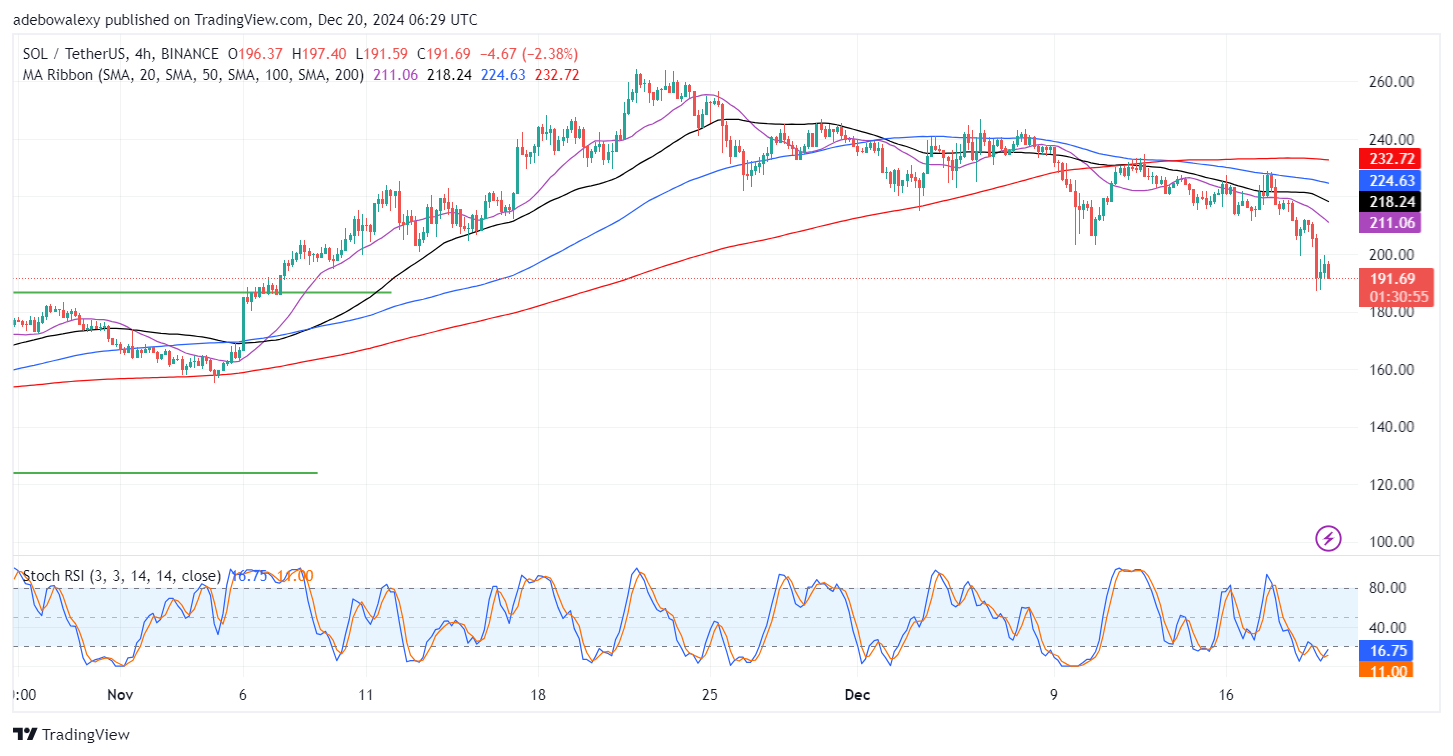
Technically, it appears that this market has two nearby support levels: one at the $190 mark and the other at the $185 threshold level. Consequently, a potential rebound may occur at the $190 or the $185 price level, toward the ceiling at the $200 price level.