Uniswap (UNI) Price Prediction: UNI/USDT Bearish Correction Is Pulling the Brakes
Estimated Reading Time: 3 minutes
Don’t invest unless you’re prepared to lose all the money you invest. This is a high-risk investment and you are unlikely to be protected if something goes wrong. Take 2 minutes to learn more
Uniswap Price Prediction (December 19):
The Uniswap market has been volatile, resulting in the market moving widely between the $18.50 and $14.00 threshold levels. Currently, there are indications that suggest the market may be resisting further downward corrections.
UNI/USDT Long-Term Trend: Bearish (Daily Chart)
Key Price Levels:
Resistance: $15, $16, $17
Support: $14, $13, $12
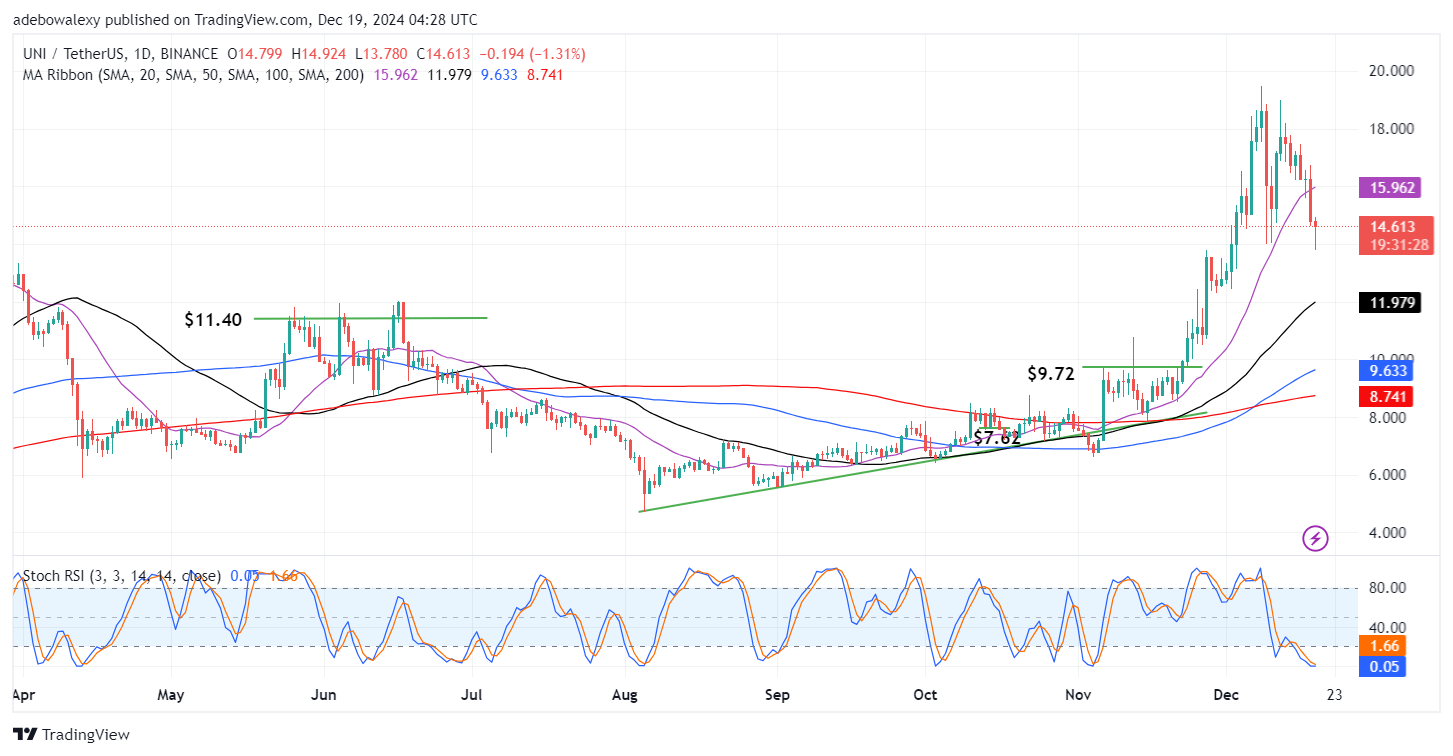
The last price candle on the chart corresponding to the ongoing session has appeared to contract upward above the $14 mark. However, this price candle has appeared below the 20-day Moving Average (MA) lines but still stands above the rest of the MA curves. Simultaneously, the Stochastic Relative Strength Index lines have reached deep into the oversold region. Likewise, the terminal part of the indicator line has now turned sideways while the lagging line of the indicator closes in for a possible crossover.
Uniswap Price Prediction: UNI/USDT Bulls Look Threatening
Indications arising from the UNI/USDT market suggest that downward forces may be fizzling out. Also, it seems like upside forces have the just grounds to regain control of the market, seeing that price action lies above most of the MA lines. The last price candle on the chart appears contracted upward, and this suggests that upside forces are active.
However, more efforts may be needed as it appears that the downward troops aren’t ready to give up that easily. Meanwhile, the Stochastic RSI lines are now in the oversold region but seem to be converging for an upward crossover there.
Uniswap Price Prediction: UNI/USDT Bearish Momentum Grows Thinner (4-Hour Chart)
Price action in the Uniswap 4-hour market appears to have more downward progress across the MA lines. Price activity here has fallen below most of the MA lines. As a result, price action only lies above the 200-day MA curve.
However, the last price candle has appeared very small, indicating that downward forces are getting weaker. Likewise, the Stochastic RSI lines are converging for a bullish crossover in the depth of the indicator’s oversold cone. Consequently, market participants can expect an upward price rebound in this market.