Bitcoin (BTC) Price Prediction: BTC/USDT Bounces Off a New All-Time High
Estimated Reading Time: 3 minutes
Don’t invest unless you’re prepared to lose all the money you invest. This is a high-risk investment and you are unlikely to be protected if something goes wrong. Take 2 minutes to learn more

Bitcoin Price Prediction December 18:
The Bitcoin market recently hit a new all-time high at the $108,000 price level. However, currently, the price action of this token has rebounded downward in today’s trading activity so far. Nevertheless, the market stays at an elevated distance above key levels, which may assist upside forces shortly.
BTC/USDT Long-Term Trend: Bearish (Daily Chart)
Key Price Levels:
Resistance: $110,000, $115,000, $120,000
Support: $100,000, $95,000, $90,000
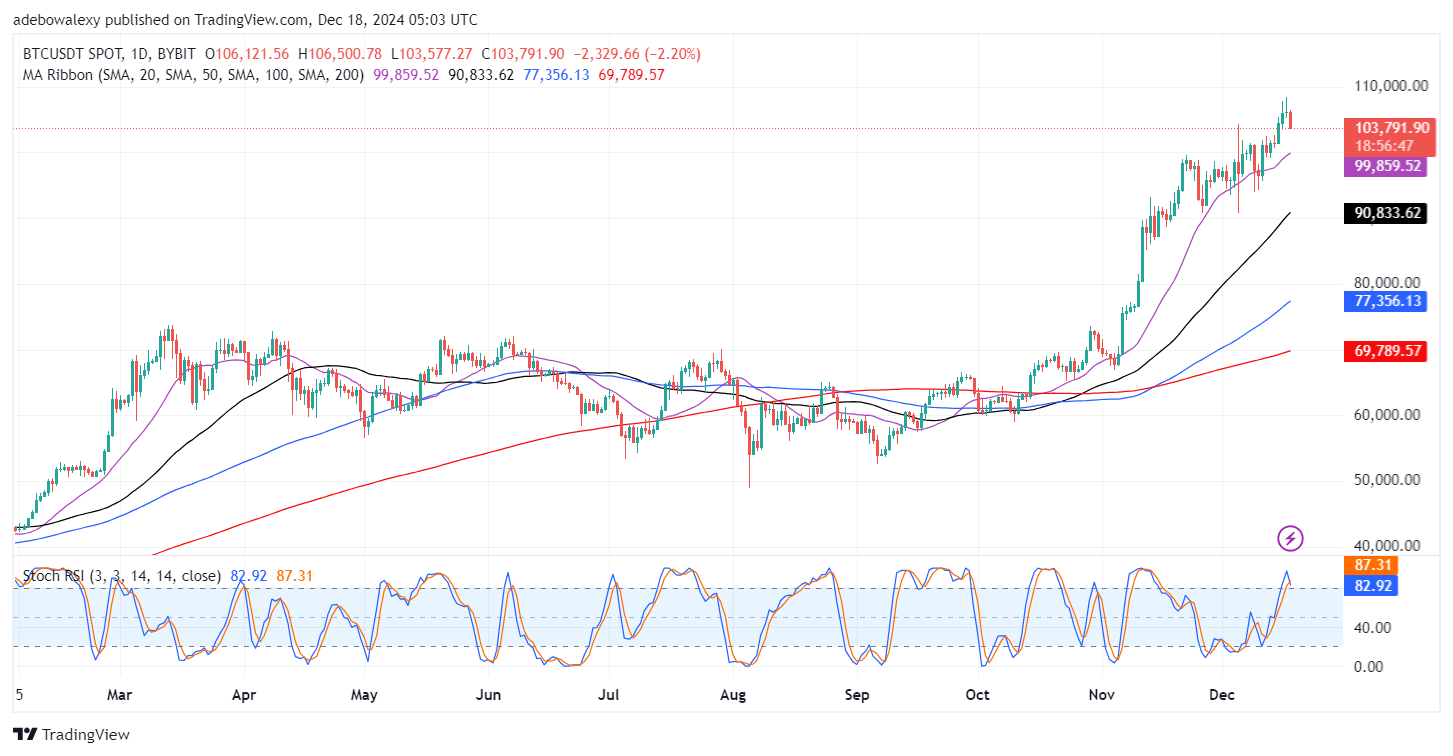
The corresponding price candle to the ongoing session can be seen appearing bearish. This technically erased the modest upside correction of the past two sessions. Despite the moderate downward retracement, price activity stays above all the Moving Average (MA) lines. Meanwhile, the Stochastic Relative Strength Index (RSI) lines have already delivered a bearish crossover above the 80 threshold of the indicator.
Bitcoin Price Prediction: BTC/USDT Bears Look Threatening
Price activity in the Bitcoin market has undoubtedly achieved a new all-time high. However, it appears that the market seems to have equally drawn some bearish attention, as price action seems to have hit a significant amount of take-profit orders. Be that as it may, price action stays above all the MA lines. The last price candle on the chart stands above all the MA curves on the daily chart.
In addition, the Stochastic RSI has already delivered a bearish crossover in the overbought region. Consequently, all the available indications here imply that the downward forces are more dominant in this market at the moment. However, a more careful look at price action in this market may be necessary.
Bitcoin Price Prediction: BTC/USDT Eyes a Nearby Support Level (4-Hour Chart)
Price action in the Bitcoin 4-hour market has progressed below the 20-day MA curve. Also, a new session has begun there with the corresponding price candle appearing red. Meanwhile, price activity remains above the 50-, 100-, and 200-day MA curves. Despite these, the Stochastic RSI indicator lines have fallen deep into the oversold region of the indicator.
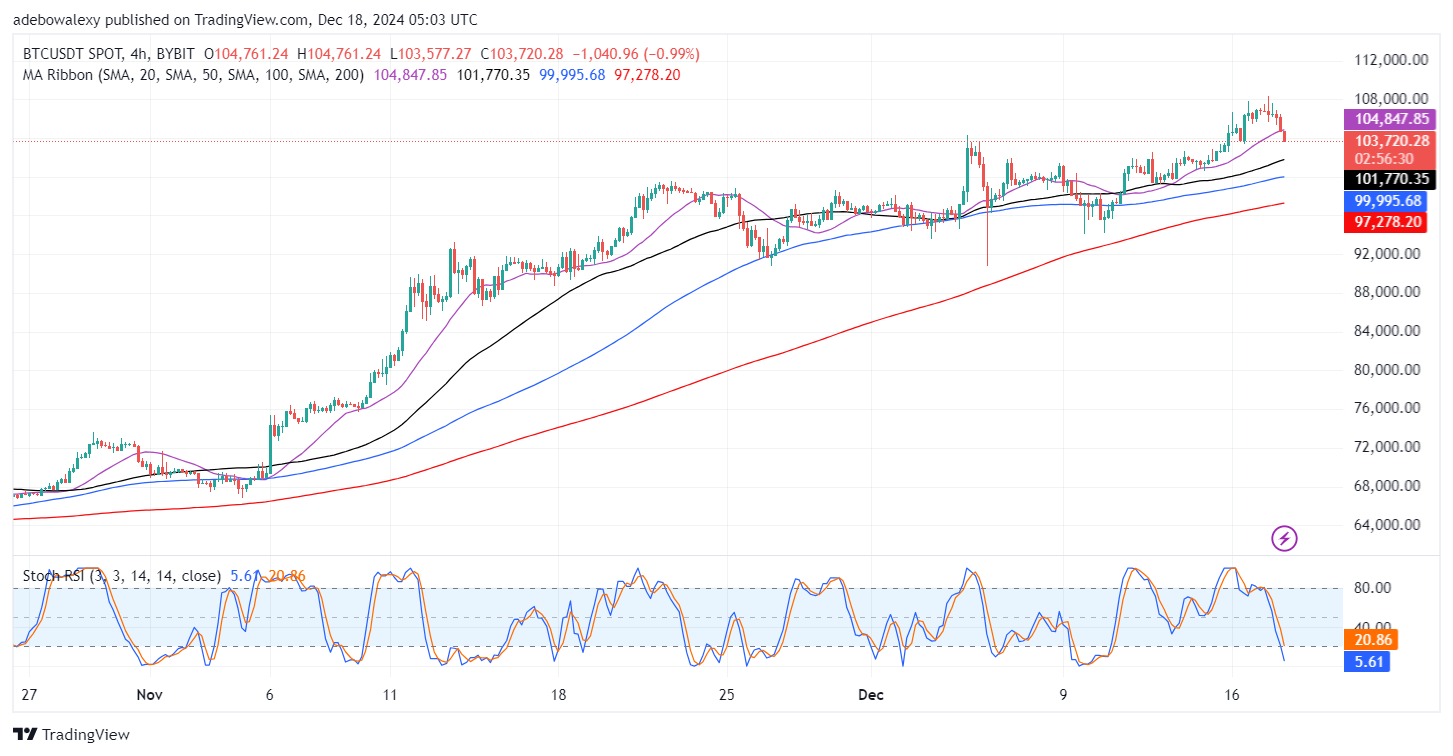
By implication, indications emanating from trading indicators suggest that price activity is eyeing a nearby support level. Considering the movement of the Stochastic RSI line, it appears that the $103,000 may form a strong support. And if that fails, the $102,000 base level should hold.