Litecoin (LTC) Price Prediction: LTC/USDT Extends Downward Retracement
Estimated Reading Time: 3 minutes
Don’t invest unless you’re prepared to lose all the money you invest. This is a high-risk investment and you are unlikely to be protected if something goes wrong. Take 2 minutes to learn more

Litecoin Price Prediction December 17:
Even though the Bitcoin market has reached a new all-time high of $106,000, the Litecoin market continues to retrace downward. While the market is currently above a support level, suggesting that the downward retracement may be short-lived, short-term bearish sentiment persists among market participants.
LTC/USDT Long-Term Trend: Bearish (Daily Chart)
Key Price Levels:
Resistance: $120, $130, $140
Support: $105, $95, $85
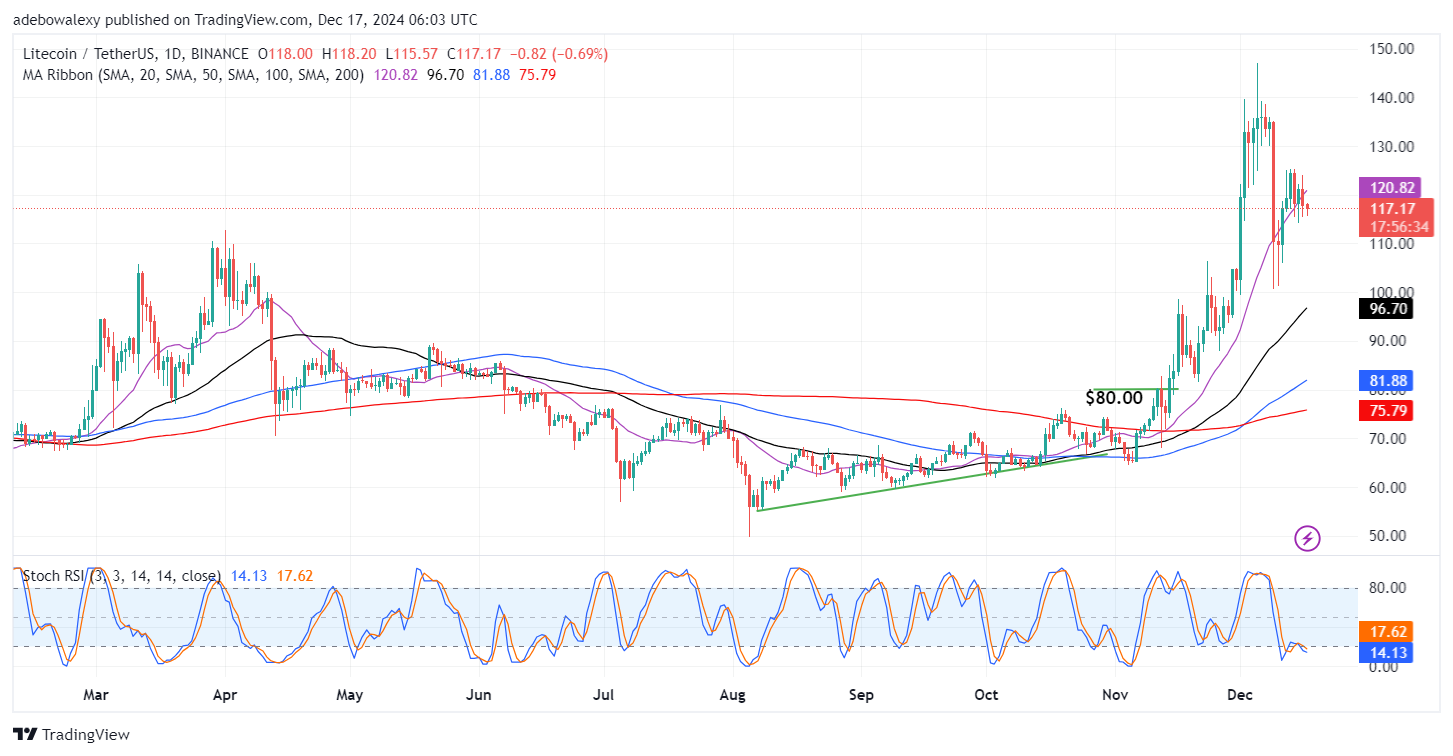
The ongoing session in the Litecoin daily price chart appears bearish. As a result, the token is now trading below the 20-day Moving Average (MA) lines. However, it’s worth noting that other MA curves lie below all price action on the chart. Meanwhile, the Stochastic Relative Strength Index lines have continued downward toward the 0.00 threshold level, aligning with the recent price trajectory.
Litecoin Price Prediction: LTC/USDT Has Short-Term Bearish Outlook
The Litecoin market has fallen below the technical price level of $120 and the 20-day MA lines. The ongoing session may see further downward movement, although the recent bearish candles have been smaller than previous ones.
Additionally, the Stochastic RSI lines are depressed and progressing deeper into the oversold region. The lines of the indicator are already deep in the oversold region, limiting further downward potential. Technically, this suggests that price action has only a short-term bearish outlook.
Litecoin Price Prediction: LTC/USDT Bearish Target Revealed (4-Hour Chart)
While the Litecoin daily market indicates a bearish outlook, the 4-hour chart provides more specific insights into the potential target for downward movement. The last price candle is bearish and has fallen below the 20-, 50-, and 100-day MA lines. Furthermore, the Stochastic RSI lines have delivered a bearish crossover just above the 50 level of the indicator.
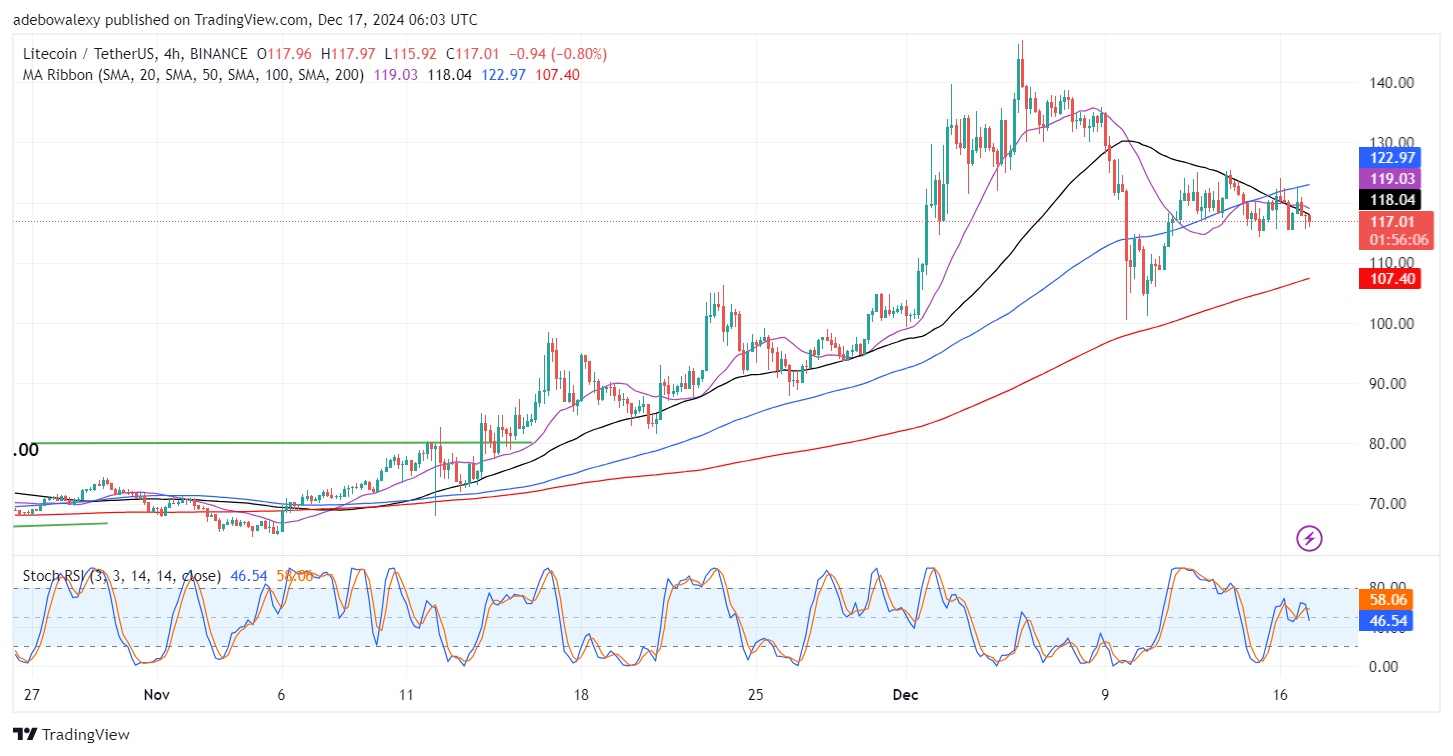
The ensuing lines of the indicator are falling downward toward the oversold region. Technically, the market direction seems aligned between the daily and 4-hour charts. The 4-hour chart suggests that the potential target for downward movement is the $110 price level, as it’s the next significant technical support level.