Dogecoin (DOGE) Price Prediction: DOGE/USDT Still Struggles Below Key Levels
Estimated Reading Time: 3 minutes
Don’t invest unless you’re prepared to lose all the money you invest. This is a high-risk investment and you are unlikely to be protected if something goes wrong. Take 2 minutes to learn more

Dogecoin Price Prediction December 16:
Price activity in the Dogecoin market continues to suggest that the market lacks direction in the meantime. This market has recently dwelled below important technical landmarks. As a result, traders may want to take a cautious approach in this market.
DOGE/USDT Long-Term Trend: Bearish (Daily Chart)
Key Price Levels:
Resistance: $0.4500, $0.5000, $0.5500 Support: $0.4000, $0.3500, $0.3000
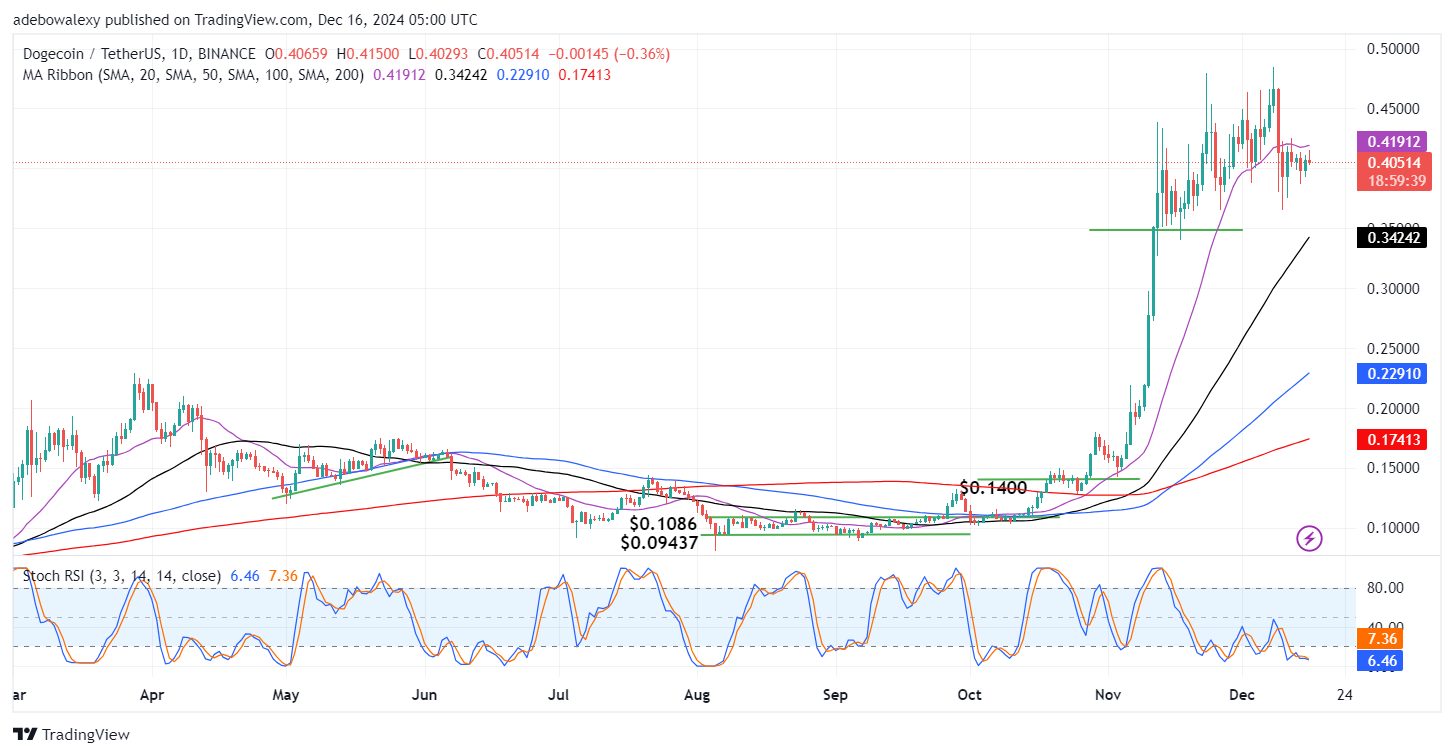
The ongoing session in this market has appeared bearish. However, the appearance of the corresponding price candle suggests that downward forces may have reached their end. As of the time of writing, trading activity continues below the 20-day Moving Average (MA) lines. Meanwhile, the Stochastic Relative Strength Index (RSI) lines are still slightly in the oversold zone of the indicator.
Dogecoin Price Prediction: DOGE/USDT Suggests that Market Participants Are Cautious
While price movement in the Dogecoin daily market continues to hint that price action lacks the needed push. As a result, this has kept the token trading below the 20-day MA lines for the past roughly seven sessions. The last price candle does appear bearish but also seems to be suggesting that downward forces may just be reaching their end.
This opinion emanates from the appearance of the last price candle as an inverted hammer price candle. However, the Stochastic RSI lines are still falling slightly into the oversold region of the indicator. Generally, everything still points to the fact that downward forces are running out of steam, seeing that the RSI lines are almost at the terminal level.
Dogecoin Price Prediction: DOGE/USDT Retains a Depressed Look (4-Hour Chart)
In the Dogecoin 4-hour market, price action continues to lack bullish motivations. Here, the MA lines are more converged. As a result, price action has fallen below most of the MA lines, with the 20-day MA curve being the only MA line below price action in this market. The last and recent price candles are still appearing quite small and as such hint that there is lesser participation in this market.
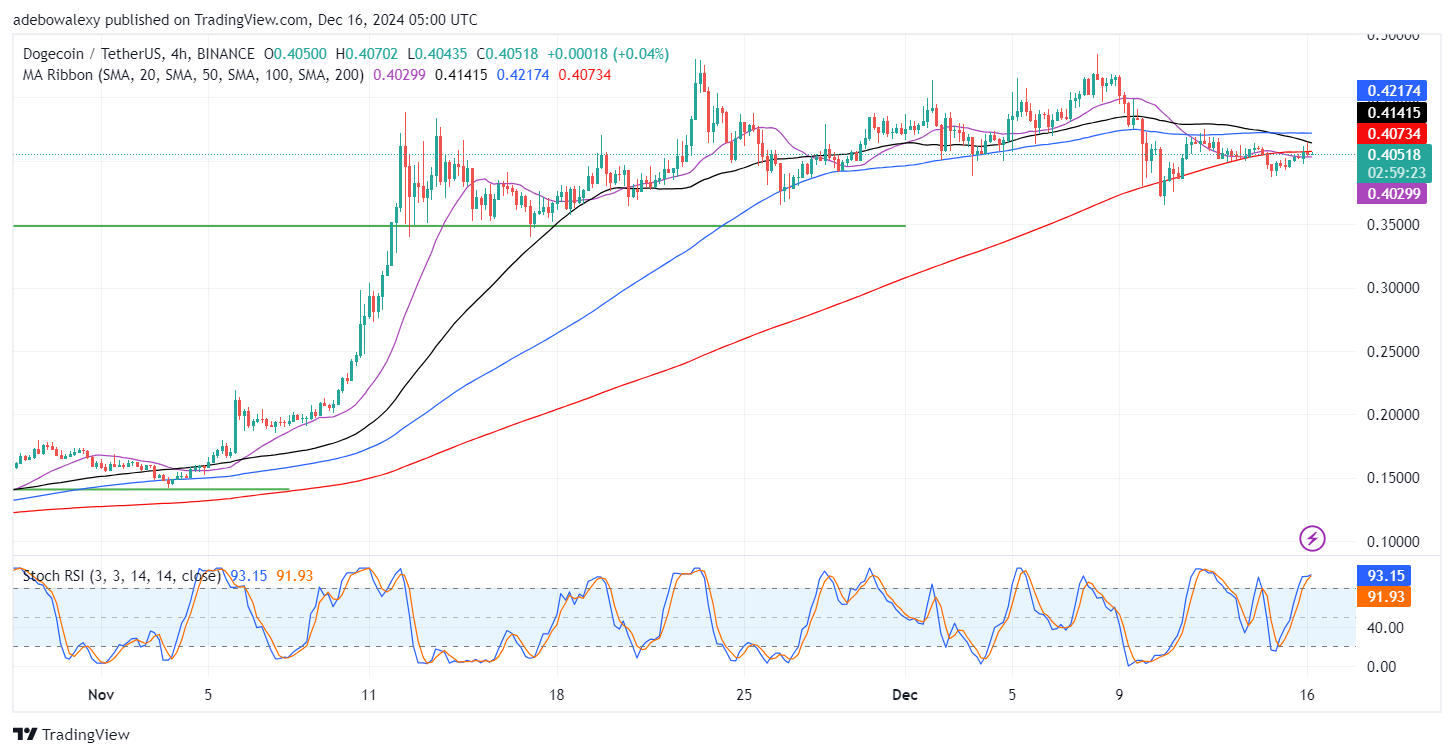
Meanwhile, the Stochastic RSI lines are in the overbought region despite the minimal price movement in the market. Indications in this market point to the fact that participants lack motivation. However, with price action in this market needing the arrival of a key catalyst, only then will traders acquire enough bullish conviction towards the $0.4500.