Polkadot Regain Bullish Momentum as It Approaches $6.00
Estimated Reading Time: 2 minutes
Don’t invest unless you’re prepared to lose all the money you invest. This is a high-risk investment and you are unlikely to be protected if something goes wrong. Take 2 minutes to learn more
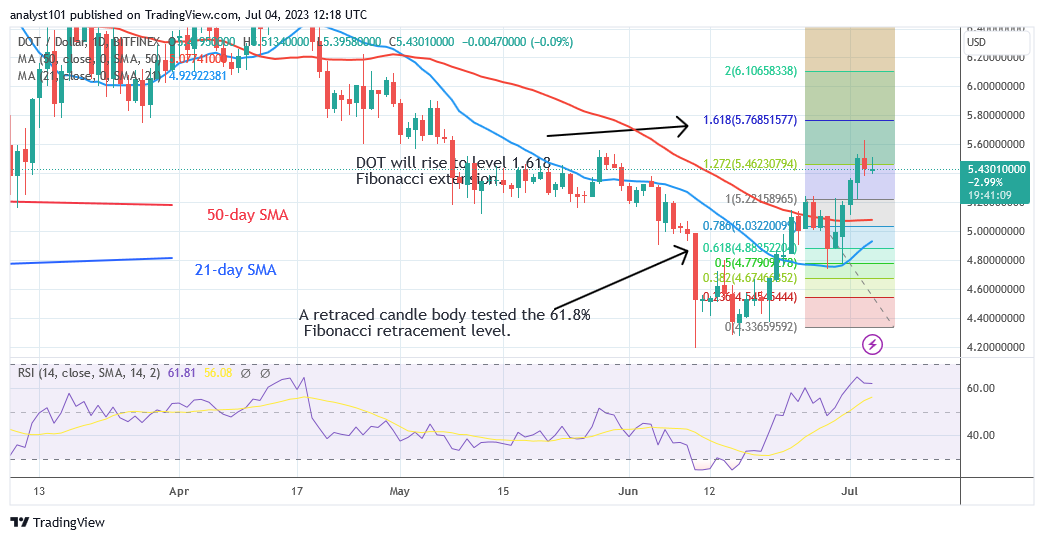
Polkadot (DOT) Long-Term Analysis: Bullish
Polkadot (DOT) has broken through the $5.20 resistance level as it approaches $6.00. As the altcoin climbs to a high of $5.60, the bullish momentum breaches over the moving average lines. The market rose to an overbought territory, and the coin was rejected at its latest high. On the plus side, if the altcoin retraces above the moving average lines, the present rise may continue.
The coin will increase once more, returning to earlier highs of $7.00 and $7.50. The downtrend will restart if the DOT price retraces below the moving average lines. Polkadot will fall to the previous low of $4.18. The DOT price has now retraced to a low of $5.35. Meanwhile, the cryptocurrency is trading above the moving average lines.
Technical indicators:
Major Resistance Levels – $10, $12, $14
Major Support Levels – $8, $6, $4
Polkadot (DOT) Indicator Analysis
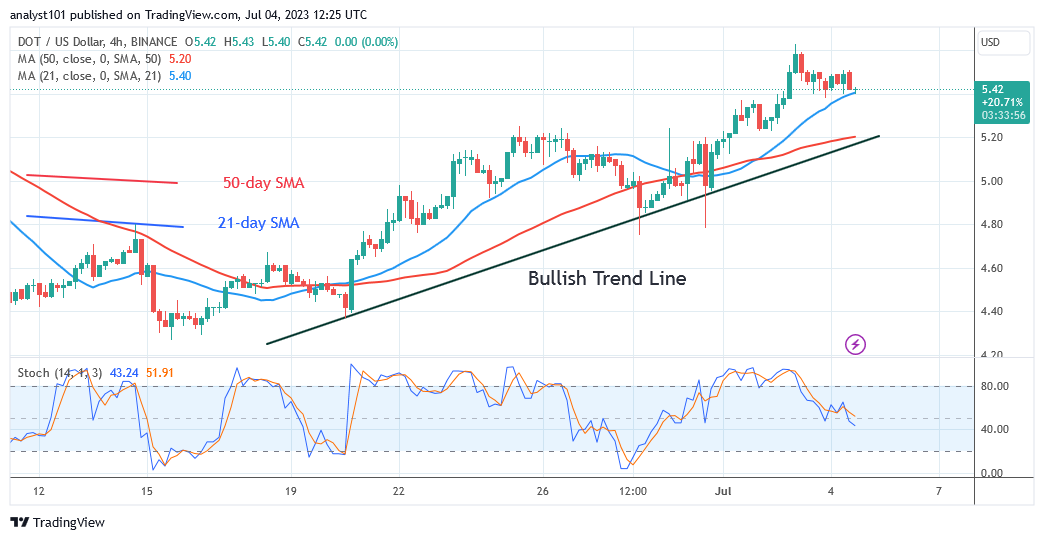
The altcoin is in an uptrend at level 58 of the Relative Strength Index for period 14. Following the recent rally, the price bars are above the moving average lines. If the price maintains above the moving average lines, the uptrend will continue. DOT is currently in a negative trend below level 40 on the daily Stochastic.
What Is the Next Direction for Polkadot (DOT)
Polkadot has recovered its positive momentum and is now trading above the moving average lines as it approaches $6.00. As the price bars move above the moving average lines, the altcoin is predicted to rise. The current uptrend is predicted to peak at $6.00.
You can purchase Lucky Block here. Buy LBLOCK
Note: Cryptosignals.org is not a financial advisor. Do your research before investing your funds in any financial asset or presented product or event. We are not responsible for your investing results