Polkadot Rallies to a High of $5.20 but Faces Selling Pressure
Estimated Reading Time: 2 minutes
Don’t invest unless you’re prepared to lose all the money you invest. This is a high-risk investment and you are unlikely to be protected if something goes wrong. Take 2 minutes to learn more
Polkadot (DOT) Long-Term Analysis: Bullish
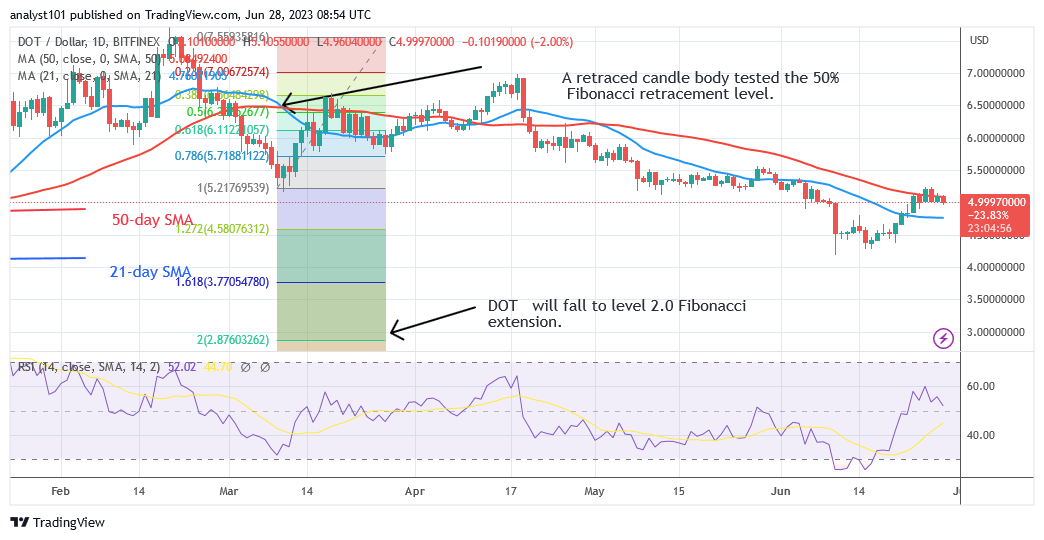
Polkadot (DOT) price reaches a high of $5.20 but faces selling pressure. Bullish momentum broke through the moving average lines but was halted around the $5.20 high. The altcoin is plummeting because the market has become overbought. It is improbable that the coin will continue to rise.
Furthermore, the price indicator has forecast that the cryptocurrency would continue to fall.
It predicts that the market will fall as low as $2.87. In the meantime, the DOT price has dropped between the moving average lines. If the moving average lines remain unbroken, the altcoin will be forced to trade in a range for several days.
On the downside, the decline will resume if the DOT price retraces and violates the present support level of $4.18. Polkadot is expected to reach a low of $2.87. It is now trading between the moving average lines.
Technical indicators:
Major Resistance Levels – $10, $12, $14
Major Support Levels – $8, $6, $4
Polkadot (DOT) Indicator Analysis
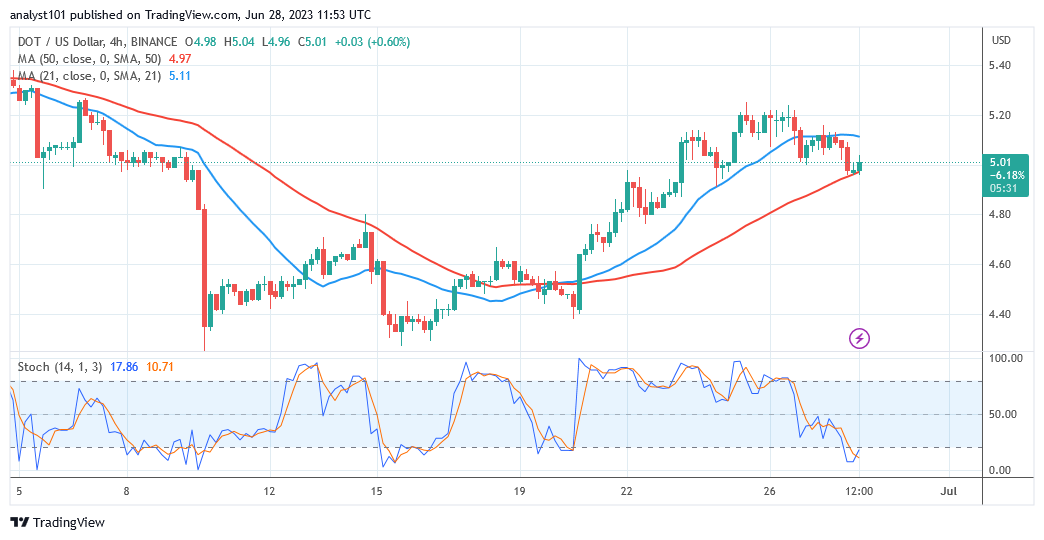
The altcoin is at level 52 of the Relative Strength Index level 44 for period 14. The altcoin is retracing its steps away from the positive trend zone. The price bars are between the moving average lines, indicating that the altcoin will begin to move sideways. Polkadot is currently in the market’s oversold zone. It is below the daily Stochastic level of 20.
What Is the Next Direction for Polkadot (DOT)
Polkadot has hit the high of $5.20 but faces selling pressure. Currently, the cryptocurrency is caught between the moving average lines. When the price falls below the 21-day SMA, selling pressure will resume. The bullish trend will begin if the price breaks above the 50-day SMA.
You can purchase Lucky Block here. Buy LBLOCK
Note: Cryptosignals.org is not a financial advisor. Do your research before investing your funds in any financial asset or presented product or event. We are not responsible for your investing results