Polkadot Risks Decline as It Struggles below the $5.00 High
Estimated Reading Time: 2 minutes
Don’t invest unless you’re prepared to lose all the money you invest. This is a high-risk investment and you are unlikely to be protected if something goes wrong. Take 2 minutes to learn more
Polkadot (DOT) Long-Term Analysis: Bearish
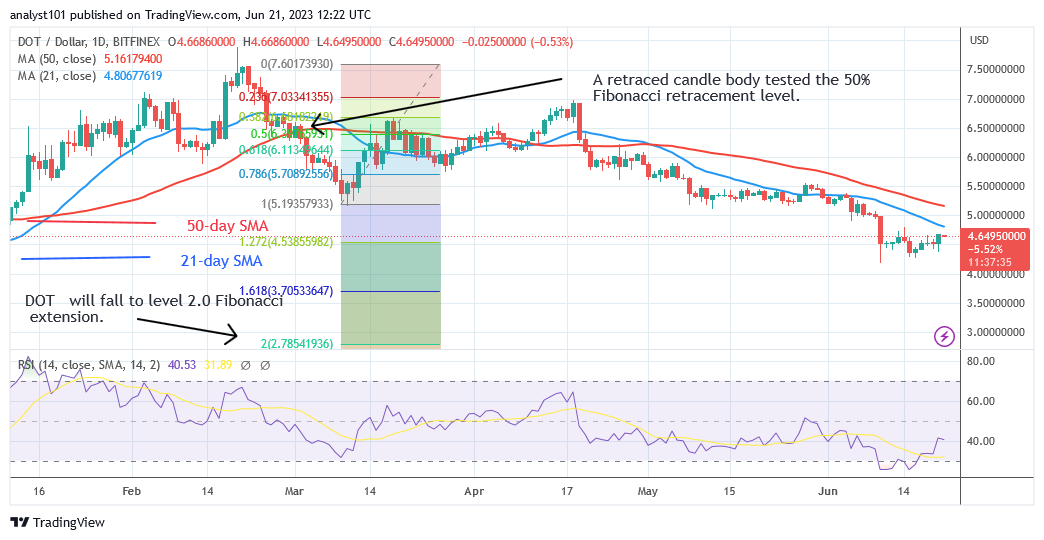
The price of Polkadot (DOT) is falling below the moving average lines as it struggles below the $5.00 high. The altcoin has been consolidating above the $4.18 support since the price drop on June 10. The $5.00 resistance level or the 21-day SMA is currently impeding upward movements.
The altcoin can continue to fall in value, says the price indicator. DOT price made an upward correction on March 9 after a price slump, and a candle body tested the 50% Fibonacci retracement level. According to the correction, DOT will drop to level 2.0 of the Fibonacci extension, or level $2.78.
Polkadot is still fluctuating above the $4.00 support in the interim.
Polkadot (DOT) Indicator Analysis
The cryptocurrency has risen to Relative Strength Index level 44 for period 14. Despite the upward correction, the coin is still in the bearish trend zone.
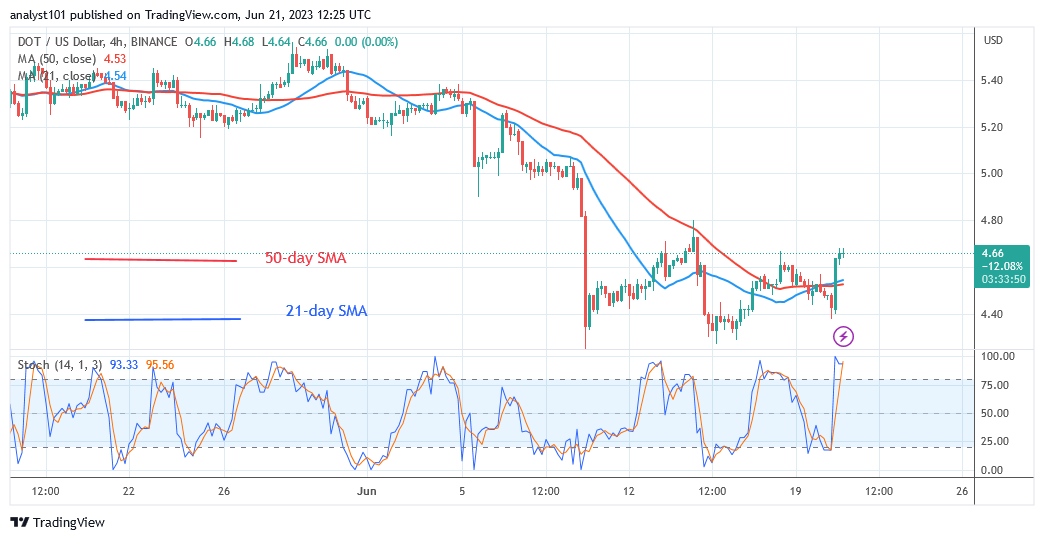
The price bars are lower than the moving average lines, causing them to fall. The altcoin is currently being rejected at the 21-day SMA. Polkadot risks decline because it is above the daily Stochastic level of 80.
Technical indicators:
Major Resistance Levels – $10, $12, $14
Major Support Levels – $8, $6, $4
What Is the Next Direction for Polkadot (DOT)?
Polkadot is trading in an overbought market area as it struggles below the $5.00 high. The coin will decline as sellers emerge in the overbought region. The price bars are currently retesting the 21-day SMA.
A rejection at the recent high will result in the cryptocurrency falling even further.
You can purchase Lucky Block here. Buy LBLOCK
Note: Cryptosignals.org is not a financial advisor. Do your research before investing your funds in any financial asset or presented product or event. We are not responsible for your investing results