Litecoin (LTC/USD) Returns to $120: Bulls Eye a Breakout
Estimated Reading Time: 3 minutes
Don’t invest unless you’re prepared to lose all the money you invest. This is a high-risk investment and you are unlikely to be protected if something goes wrong. Take 2 minutes to learn more
In today’s trading session, Litecoin has once again approached the critical $120 price level, a zone that previously acted as a strong resistance when bullish momentum was rejected around July 22. The repeated rejection at this level reinforces its significance as a key resistance point.
However, current market dynamics suggest that the bulls may now be in a stronger position to challenge this barrier. With volatility gradually declining and bullish sentiment maintaining control, a potential breakout above the $120 level could be on the horizon—setting the stage for further upward movement.
Litecoin (LTC/USD) Market Data
- LTC/USD Price Now: $119
- LTC/USD Market Cap: $9 billion
- LTC/USD Circulating Supply: 76 million LTC
- LTC/USD Total Supply: 84 million LTC
- LTC/USD CoinMarketCap Ranking: #19
Key Levels
- Resistance: $0.035, $0.040, and $0.045
- Support: $0.030, $0.025, and $0.020
Litecoin (LTC/USD) Technical Outlook: Signs of Consolidation Near Key Resistance
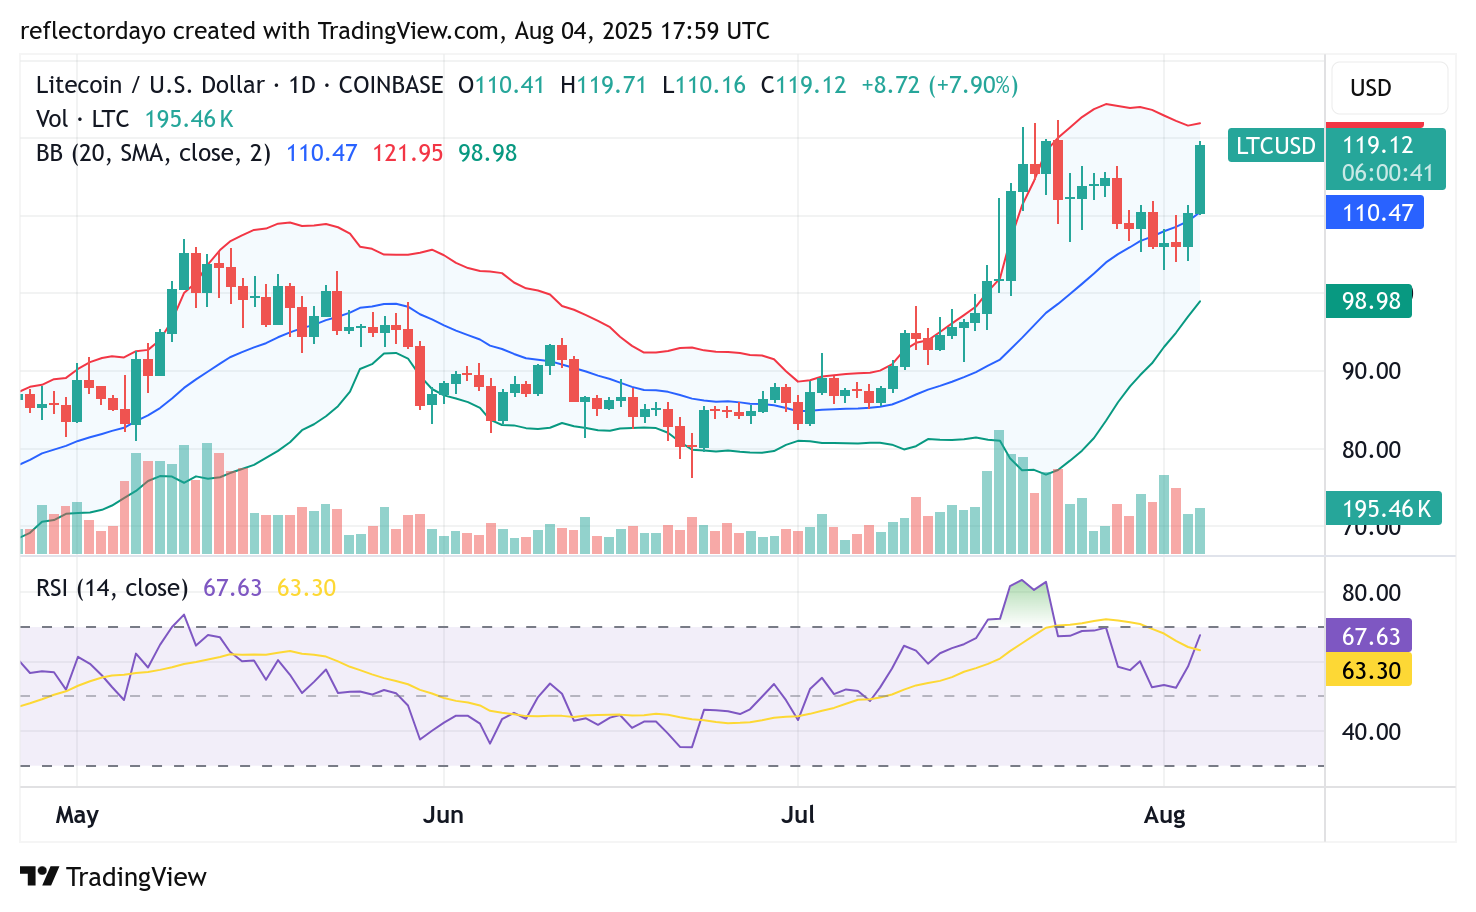
The Bollinger Bands are currently showing signs of convergence, reflecting a tightening market as Litecoin price action climbs from the $100 level. As Litecoin approaches the critical $120 resistance zone, trader indecision is becoming more apparent, with market participants adopting a more cautious stance.
Despite recent candlesticks reflecting bullish dominance, the market appears to be reaching a state of equilibrium, with price hovering around the $119 level. The narrowing Bollinger Bands suggest that if bulls manage to maintain control, the price could enter a consolidation phase around this level before the next significant move unfolds.
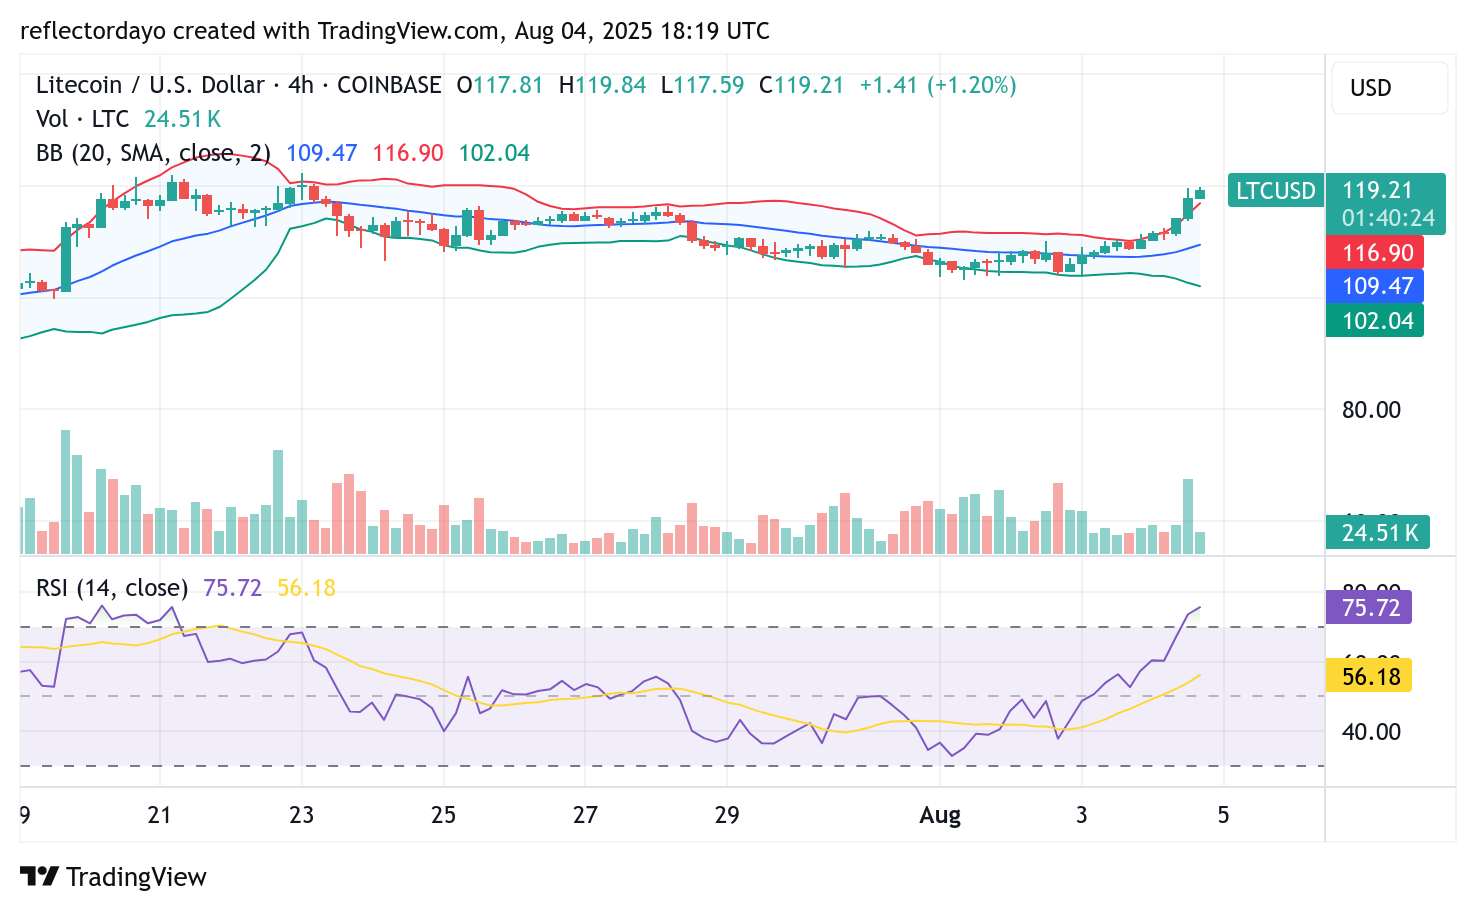
LTC/USD 4-Hour Chart: Signs of Correction as Momentum Weakens
From the 4-hour chart perspective, the Litecoin market appears primed for a potential correction, with the $115 level emerging as a likely support zone. The Relative Strength Index (RSI) is currently signaling overbought conditions, indicating that bullish momentum may be waning.
Additionally, the trading volume is on a noticeable decline, suggesting reduced buying interest. Given these signals, traders should prepare for a possible pullback and watch for reentry opportunities around the $115 support level.