IoTeX (IOTX/USD) Bulls Establish New Higher Support at $0.03
Estimated Reading Time: 3 minutes
Don’t invest unless you’re prepared to lose all the money you invest. This is a high-risk investment and you are unlikely to be protected if something goes wrong. Take 2 minutes to learn more

The IoTeX (IOTX/USD) market began a strong bullish rally around July 8, marked by a clear upside breakout. As the price advanced, it encountered resistance near the $0.03 level, triggering heightened volatility and a series of sharp price swings.
Despite the turbulence, bullish momentum ultimately prevailed. The price has since managed to hold above the $0.03 mark, successfully flipping this former resistance into a new support level. This development reinforces the bulls’ control and suggests the potential for further upward continuation if buying pressure persists.
The IoTeX Market (IOTX/USD) Market Data
- IOTX/USD Price Now: $0.0307
- IOTX/USD Market Cap: $277 million
- IOTX/USD Circulating Supply: 9.4 billion IOTX
- IOTX/USD Total Supply: 9.4 billion IOTX
- IOTX/USD CoinMarketCap Ranking: #163
Key Levels
- Resistance: $0.035, $0.040, and $0.045
- Support: $0.030, $0.025, and $0.020
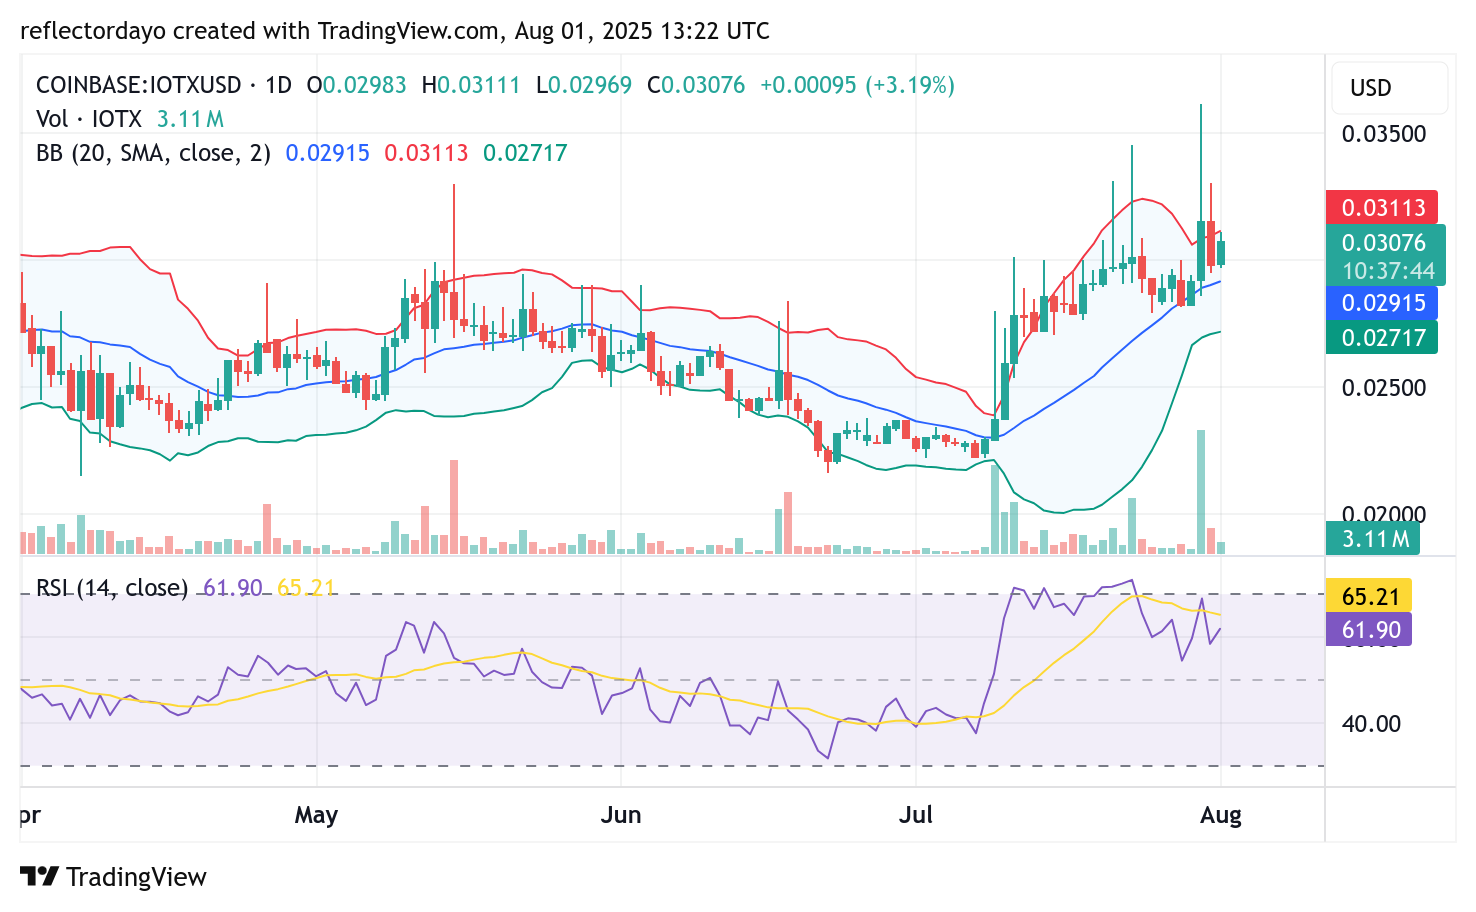
IoTeX (IOTX/USD) Technical Outlook: Bulls Hold $0.03 Amid Decreasing Volatility
Despite continued bearish pressure, the IoTeX (IOTX/USD) market has managed to sustain its position above the critical $0.03 level. This resilience suggests that the bulls are maintaining control for now, keeping the price buoyant after flipping this resistance into a support zone.
However, according to the Bollinger Bands indicator, the market is trading near the upper band, implying increased pressure for a potential pullback. Still, with bulls asserting strength at this level and demand and supply appearing evenly balanced, volatility is beginning to decline.
This crypto signal is further supported by the shrinking volume histogram bars, which indicate a sharp drop in trading activity. If this equilibrium between buyers and sellers continues, the market may enter a consolidation phase around the $0.03 price level.
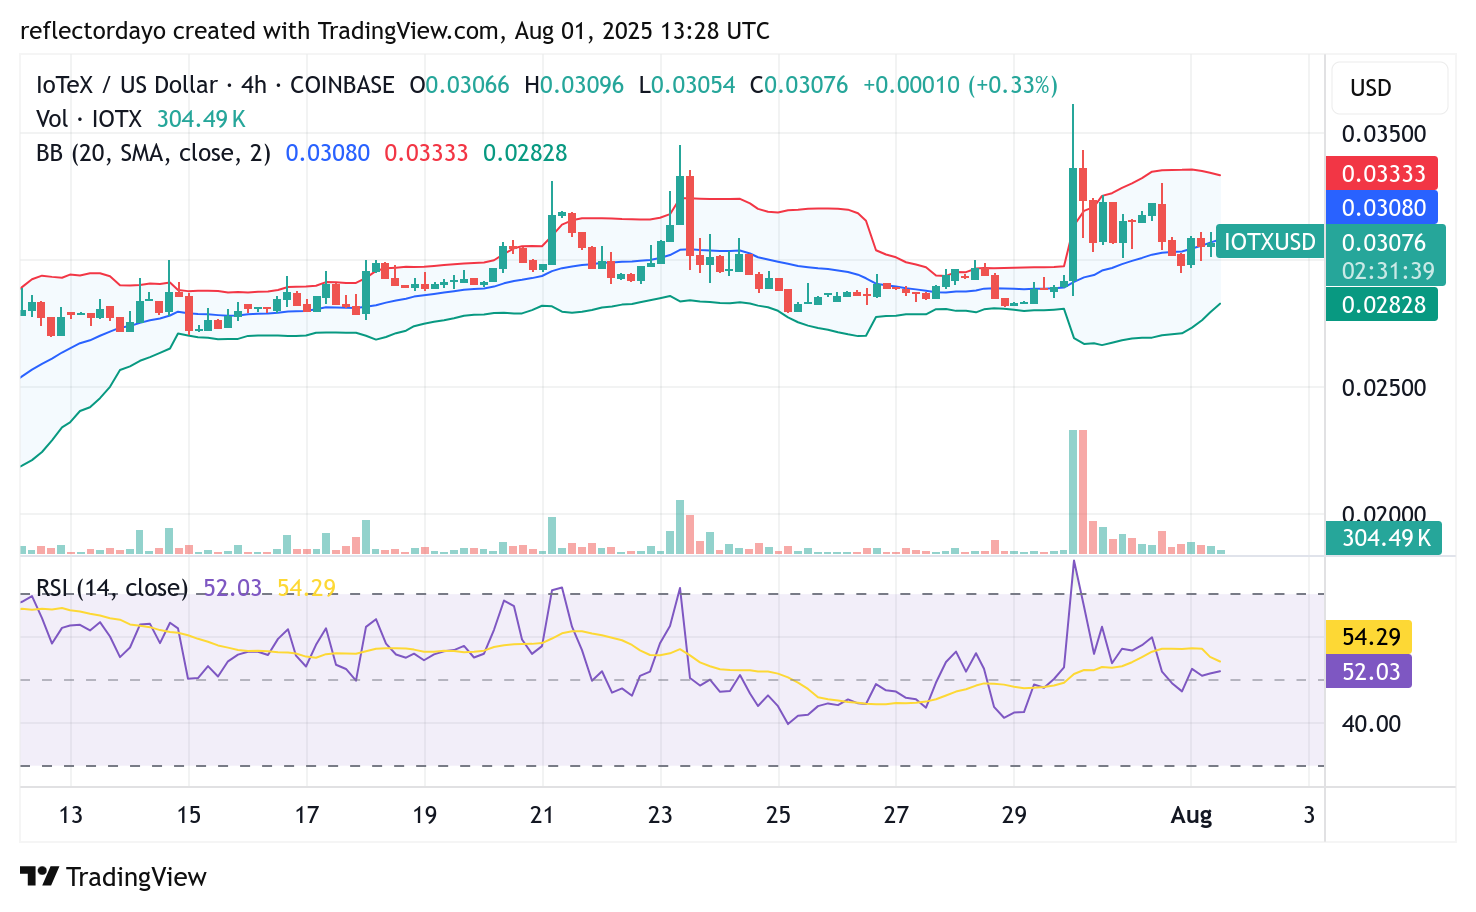
IOTX/USD 4-Hour Chart: Consolidation Emerges at Higher Support Level
The 4-hour chart analysis of IoTeX (IOTX/USD) reveals signs of an emerging consolidation phase around the newly established higher support level. Trading volume has notably declined, as reflected by the low-height histogram bars, signaling market indecision at this key zone.
Supporting this view, the Relative Strength Index (RSI) is hovering near the midpoint, indicating neutral momentum and reinforcing the likelihood of a consolidation trend. Given the strength of the prior bullish breakout, this pause in momentum may serve as a base for continuation—potentially paving the way for another upward move once the consolidation resolves.