Tamadoge (TAMA/USD) Still Continues to Hold Position at $0.001
Estimated Reading Time: 3 minutes
Don’t invest unless you’re prepared to lose all the money you invest. This is a high-risk investment and you are unlikely to be protected if something goes wrong. Take 2 minutes to learn more
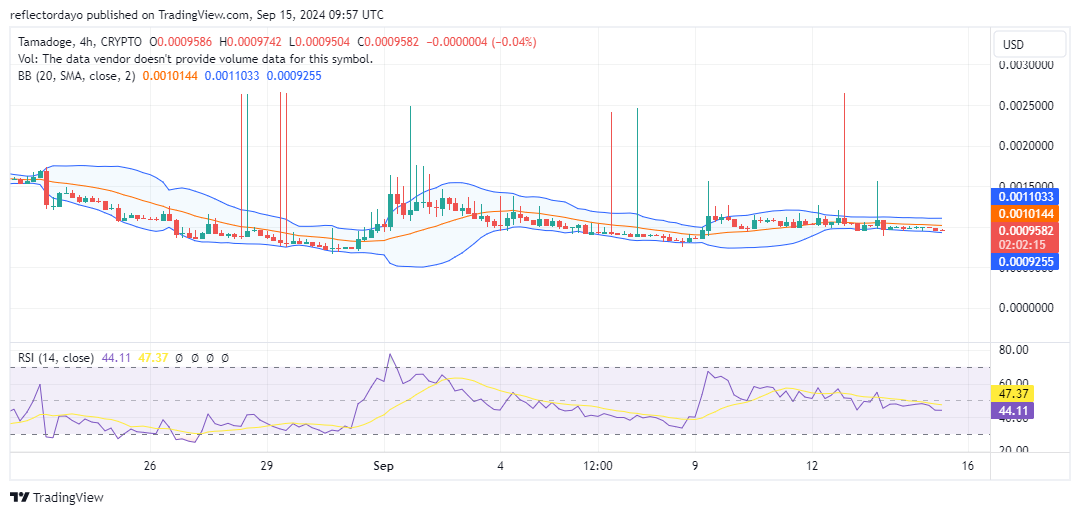
The TAMA/USD market continues to exhibit a tug-of-war between buyers and sellers, with the price remaining stubbornly anchored near the $0.001 level for several days.
As previously analyzed, bearish momentum began to build around the $0.0015 price level, characterized by descending peaks. However, bullish forces countered this downward pressure by finding support at $0.00078 and initiating an upward rebound. This convergence of bullish and bearish sentiment at the $0.001 level on September 10 has resulted in a prolonged sideways range.
Key Levels
- Resistance: $0.013, $0.014, and $0.015
- Support: $0.0008, $0.00078 and $0.00074
TAMA/USD Price Analysis: The Indicators’ Point of View
Technical indicators suggest that the TAMA/USD market remains in a state of consolidation. The convergence of highs and lows around the $0.001 level indicates ongoing market indecision. Despite bullish resilience, the consolidation phase may persist for some time.
However, there are signs of increasing bearish pressure. The price has recently slipped below the $0.001 level, settling at $0.00096. The Relative Strength Index (RSI) has also declined from near the 50 level to 44, indicating a decrease in bullish momentum.
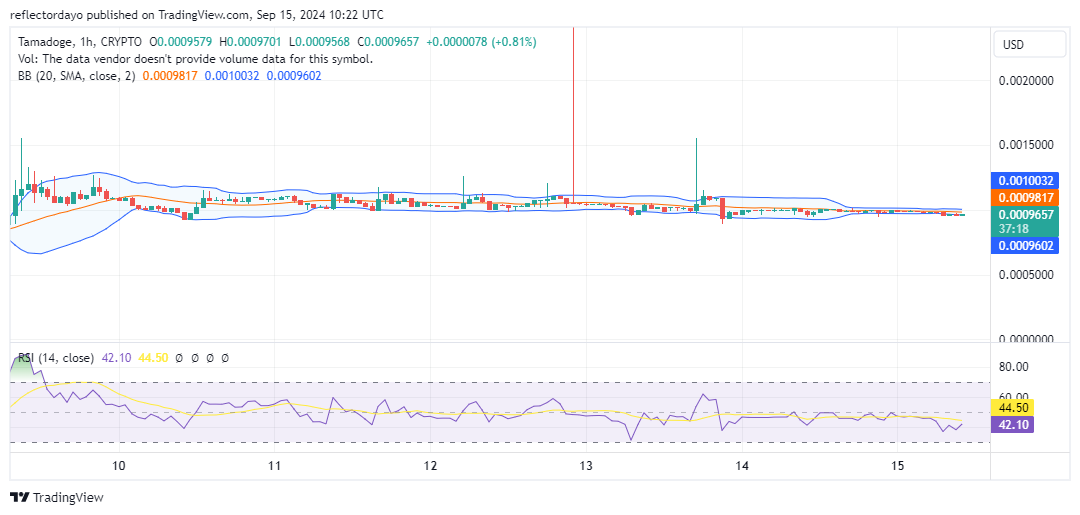
Tamadoge Short-Term Outlook: 1-Hour Chart
The 1-hour chart’s Bollinger Bands are converging, indicating a narrowing price channel. This crypto signal suggests that a significant price movement may be imminent. While traders remain cautious following a recent pullback from $0.0015, bulls have demonstrated resilience in holding the price near this level. However, there are subtle signs of bearish pressure, as the price has dipped slightly below $0.001, and the Relative Strength Index (RSI) has declined to 38, indicating growing bearish momentum. Despite these bearish indicators, the overall market structure remains largely consolidated, as evidenced by the Bollinger Bands.
Buy Tamadoge!
Fill your weekend by playing five exhilarating play-to-earn arcade games! 🕹️💰
Battle your way to the top of the weekly leaderboards and load up on $TAMA rewards!
Download on mobile now 👇
📱 Android: https://t.co/D4TjX7gTFl
📱 iOS: https://t.co/0fjJapf5oA pic.twitter.com/6MCruiKcet— TAMADOGE (@Tamadogecoin) September 13, 2024