Bancor (BTNUSD) to Escape Dormancy Trap
Estimated Reading Time: 3 minutes
Don’t invest unless you’re prepared to lose all the money you invest. This is a high-risk investment and you are unlikely to be protected if something goes wrong. Take 2 minutes to learn more
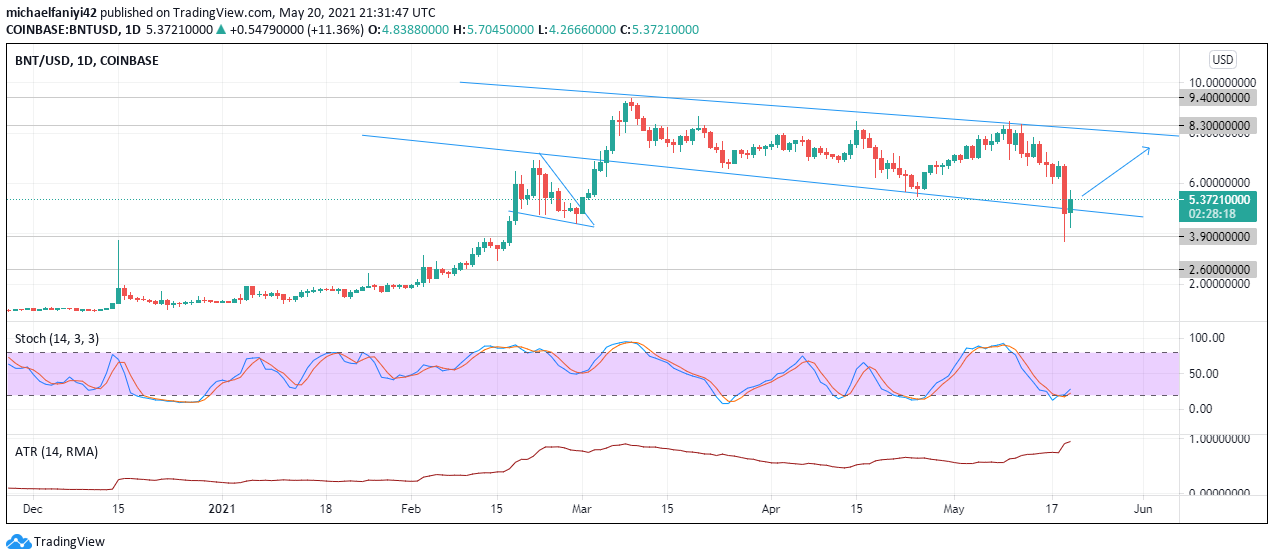
BNTUSD Key Zones
Demand Zones: 8.300, 9.400
Supply Zones: 2.600, 3.900
BNTUSD Market Analysis
BNTUSD is currently experiencing much volatility after having long stretches of market dormancy. Alongside this current period, only on two other occasions have the market experienced much volatility – at the inception of the coin and a period from 24th November 2017 to 18th July 2018, after which price relapsed back into dormancy. The dormancy can be observed in long stretches of sideways movement of price with miniature candlesticks below the 3.900 resistance line.
For the current period, the bulls rallied aggressively to eventually break the 3.900 resistance on the 17th of February, 2021. Immediately Bancor formed an ascending triangle pattern to shoot up even more beyond the reach of the 3.900 resistance to 9.400 resistance. BNT has since retained that volatility to move along a descending channel, hitting the upper and lower border of the channel intermittently.

BNTUSD Price Expectation
Yesterday on the 19th of May 2021, the sellers suddenly took over with the same strength of volatility to cause a break out downward of the coin back into the 3.900 resistance zone. The last time a similar move happened was on the 5th of February 2018. BNT rose again to regain its momentum but it eventually succumbed to the resistance of the 3.900 resistance to go back into dormancy for a long time.
Bancor is set to rally again to escape the 3.900 resistance line. As of the time of writing, a bullish candle has been formed which has risen back into the parallel channel.
The ATR (Average True Range) is currently at 0.95 which still shows much volatility compared to when the market was dormant at around 0.05. The Stochastic oscillator has its lines at the oversold region with its signal lines having crossed each other and looking upwards, showing much room for bullish activities.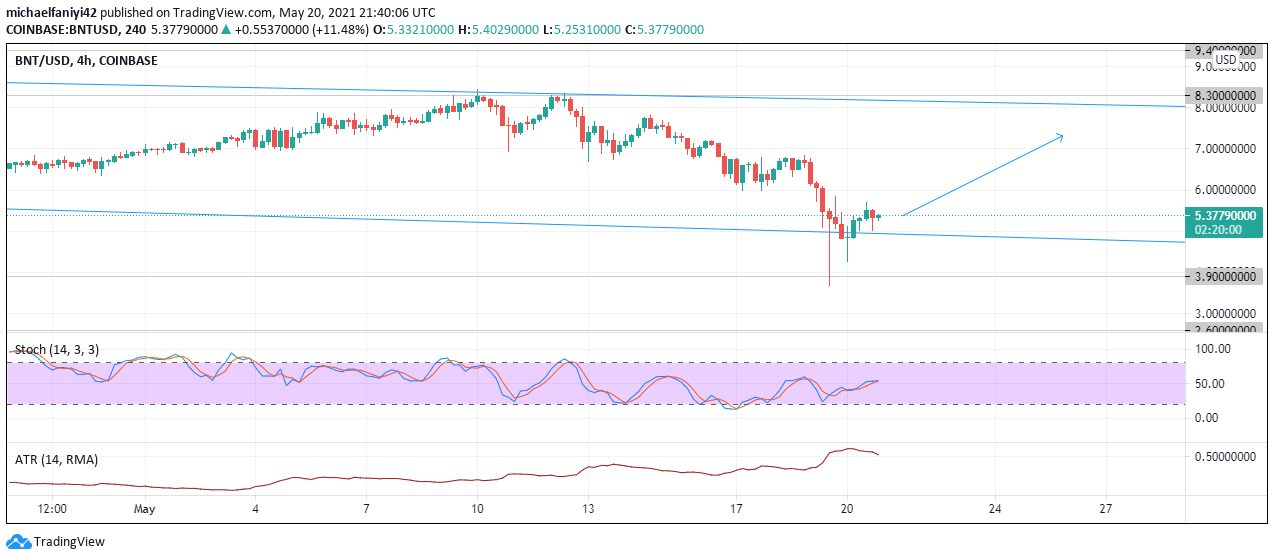
On the 4-hour time frame, more bullish candlesticks have been formed which are on the lower border of the descending channel as support. The Stochastic lines are halfway going up, which signifies continuous bullish activities. The ATR is at 0.52, showing the price is still volatile.
The market is set to rally up back into the channel and continue its movement along with it.
Note: cryptosignals.org is not a financial advisor. Do your research before investing your funds in any financial asset or presented product or event. We are not responsible for your investing results.