Polkadot Hovers above $18 as the Altcoin Faces Rejection at $23
Estimated Reading Time: 2 minutes
Don’t invest unless you’re prepared to lose all the money you invest. This is a high-risk investment and you are unlikely to be protected if something goes wrong. Take 2 minutes to learn more

Free Crypto Signals Channel

Polkadot (DOT) Long-Term Analysis: Bearish
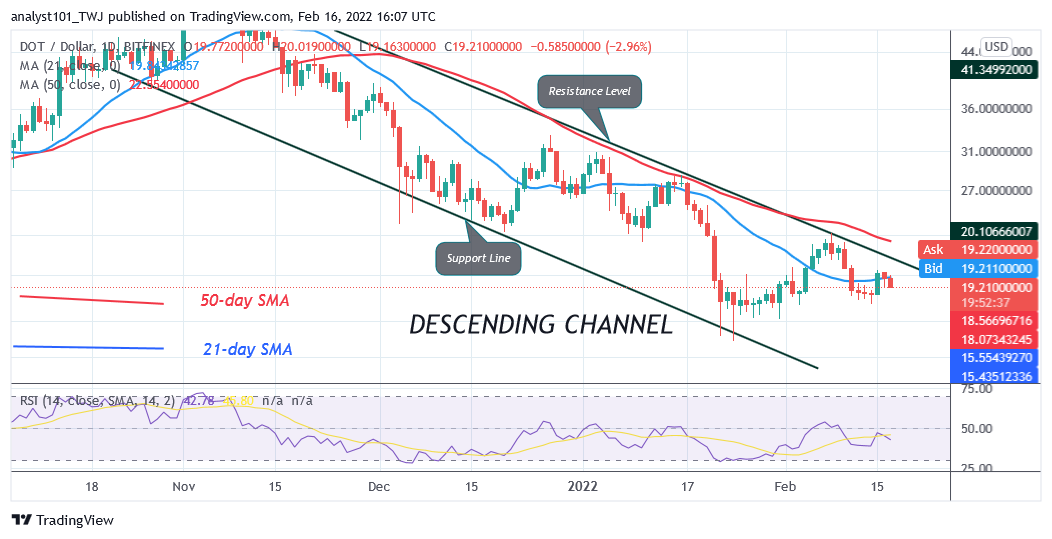
Polkadot’s (DOT) price has fallen below the moving averages as altcoin faces rejection at $23. The current downtrend is caused by bulls’ failure to break the 50-day line moving average or the $23 resistance. The breaking of the 50-day line moving average will propel the altcoin to rise to the previous highs. The previous uptrend was terminated at the high of $23 as the altcoin fell to the low of $18. On the downside, Polkadot will be fluctuating between $16 and $19, preparatory for a further upward move.
Polkadot (DOT) Indicator Analysis
The crypto’s price is at level 46 of the Relative Strength Index for period 14. Polkadot has fallen to the downtrend zone and is capable of a further downward move. Presently, the crypto’s price is below the 21-day line and the 50-day line moving averages. This deduces a possible downward move of the altcoin. DOT price is below the 80% range of the daily stochastic. The market is in a bearish momentum.
Technical indicators:
Major Resistance Levels – $48, $52, $56
Major Support Levels – $32, $28, $24
What Is the Next Direction for Polkadot (DOT)?
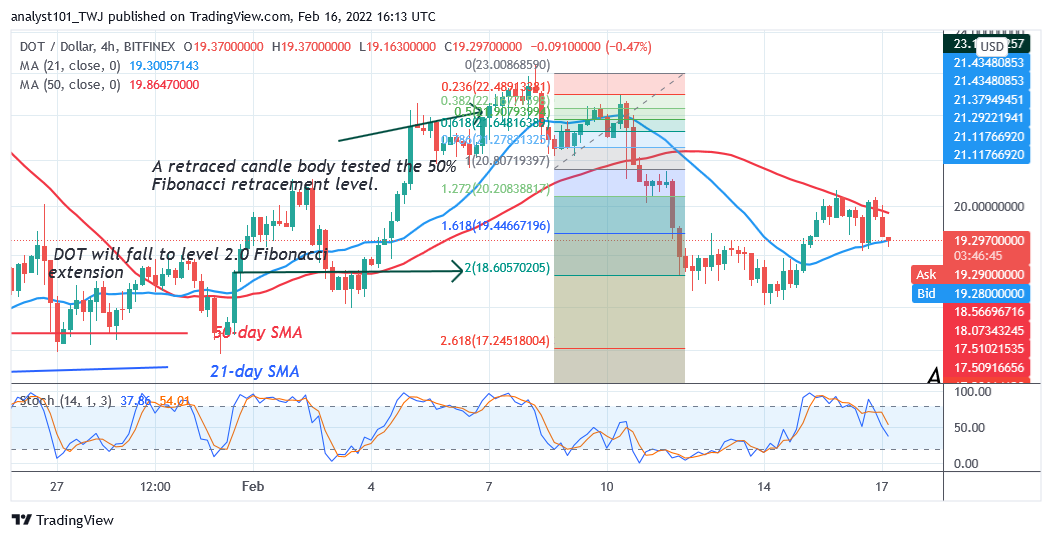
DOT/USD has resumed downward correction as altcoin faces rejection at $23. Since January 22, the downtrend has subsided as the altcoin fell to $16 low. Meanwhile, on February 8 downtrend; a retraced candle body tested the 50% Fibonacci retracement level. The retracement suggests that DOT will fall to level 2.0 Fibonacci extension or level $18.60. From the price action, DOT price is fluctuating above level 2.0 Fibonacci extension.
.
You can purchase crypto coins here. Buy Tokens
Note: Cryptosignals.org is not a 1a financial advisor. Do your research before investing your funds in any financial asset or presented product or event. We are not responsible for your investing results