Polkadot Is Stuck below $23 as Buyers and Sellers Remain Indifference
Estimated Reading Time: 2 minutes
Don’t invest unless you’re prepared to lose all the money you invest. This is a high-risk investment and you are unlikely to be protected if something goes wrong. Take 2 minutes to learn more

Free Crypto Signals Channel

Polkadot (DOT) Long-Term Analysis: Bullish
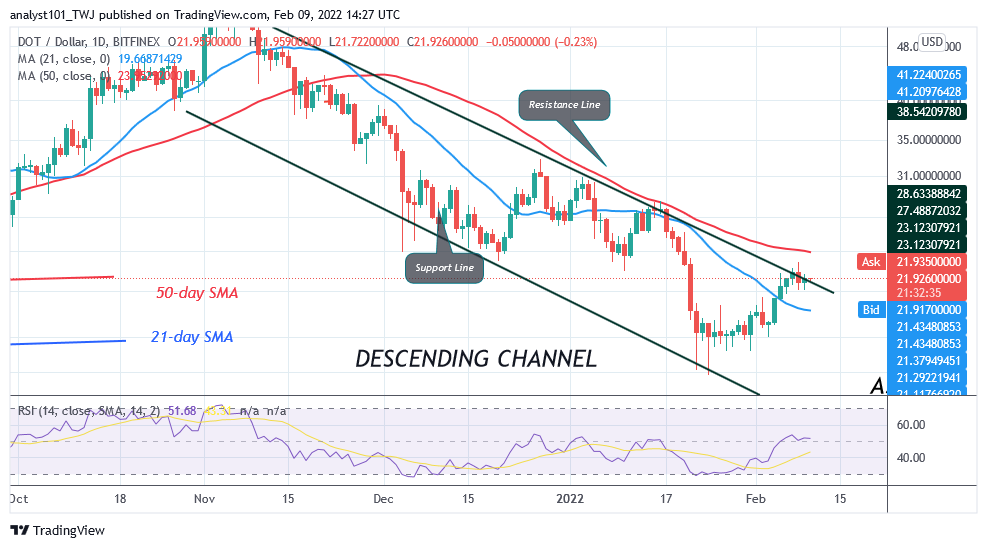
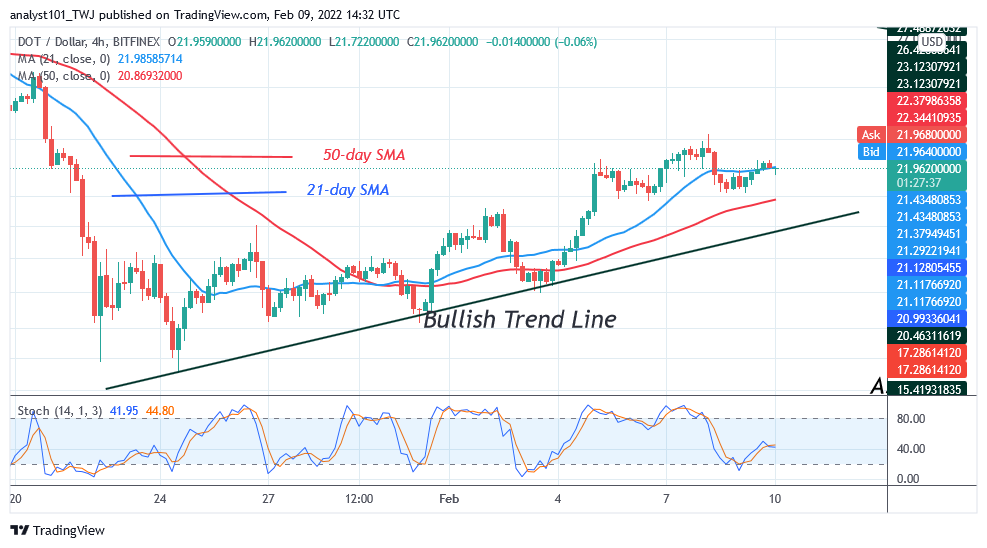
Polkadot’s (DOT) price has resumed bullish momentum but buyers and sellers remain Indifference. DOT price also broke the 21-day line moving average but failed to break the 50-day line moving average. The breaking of the 50-day line moving average will signal the resumption of upside momentum. On the upside, if price breaks above the 50-day line moving average or the $23 resistance, the market will rise to the previous highs of $28 and $32. On the other hand, if the bulls fail to break the recent high, Polkadot will be compelled to a range-bound move between the $20 and $23 price levels.
Polkadot (DOT) Indicator Analysis
The crypto’s price is above the 21-day line moving average but below the 50-day line moving average. The implication is that the altcoin will be compelled to s sideways trend. The crypto’s price is at level 52 of the Relative Strength Index for period 14. The altcoin is trading in the bullish trend zone. It is capable of a further upward move.DOT price is above the 40% range of the daily stochastic. The market is in the bullish momentum.
Technical indicators:
Major Resistance Levels – $48, $52, $56
Major Support Levels – $32, $28, $24
What Is the Next Direction for Polkadot (DOT)?
DOT/USD has resumed upward move but buyers and sellers remain Indifference. DOT price is making a series of higher highs and higher lows. The uptrend has been hindered at the $23 high. The downtrend will resume if price breaks below the moving average or the bullish trend line.
.
You can purchase crypto coins here. Buy Tokens
Note: Cryptosignals.org is not a 1a financial advisor. Do your research before investing your funds in any financial asset or presented product or event. We are not responsible for your investing results