Lucky Block Price Prediction: LBLOCK/USD Will Spike to the Upside; Buy Now!
Estimated Reading Time: 3 minutes
Don’t invest unless you’re prepared to lose all the money you invest. This is a high-risk investment and you are unlikely to be protected if something goes wrong. Take 2 minutes to learn more
Lucky Block Price Prediction – December 17
The Lucky Block price prediction reveals that LBLOCK will soon cross above the 9-day and 21-day moving averages as more buyers are expected.
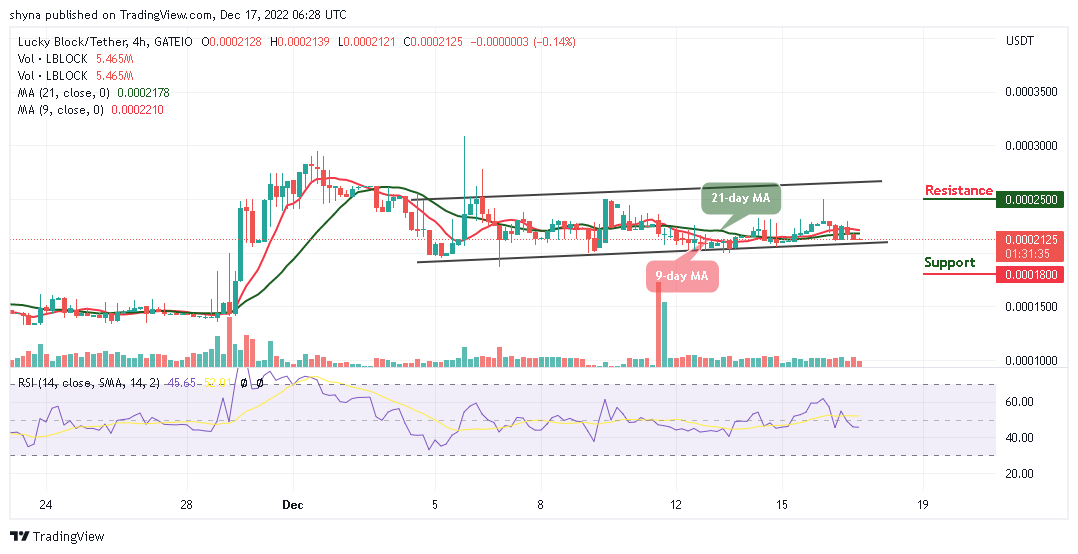
LBLOCK/USD Medium-term Trend: Ranging (4H Chart)
Key Levels:
Resistance levels: $0.00025, $0.00027, $0.00029
Support levels: $0.00018, $0.00016, $0.00014
LBLOCK/USD is ready to grow again as the crypto is in an attempt for an upward correction rally. The Lucky Block price can break above the 9-day and 21-day moving averages and resumes its uptrend if buyers should trigger their buying pressure. But, any bullish correction phase may prolong the market price to the resistance level of $0.000220, which could bring a clear buy signal.
Lucky Block Price Prediction: LBLOCK/USD Will Head to the North
The Lucky Block price is trading around $0.000212, but due to the inflows from the short traders, the coin is currently moving sideways. Meanwhile, this will soon be turned off as the bulls are now set to resume into the market for an increase. Therefore, any bullish movement towards the upper boundary of the channel will push the Lucky Block price to the resistance levels of $0.000250, $0.000270, and $0.000290.
On the contrary, the market can become very low if the bears bring the coin below the lower boundary of the channel, and sliding more could hit the supports at $0.000180, $0.000160, and $0.000140. Moreover, the technical indicator Relative Strength Index (14) is moving below the 50-level to prepare the coin for upward movement in the nearest term.
LBLOCK/USD Medium-term Trend: Ranging (2H Chart)
Looking at the 2-hour chart, the Lucky Block price is ready to break above the 9-day and 21-day moving averages. The long-term moving averages will keep the bullish movement as the market is starting a new trend in the next positive direction.
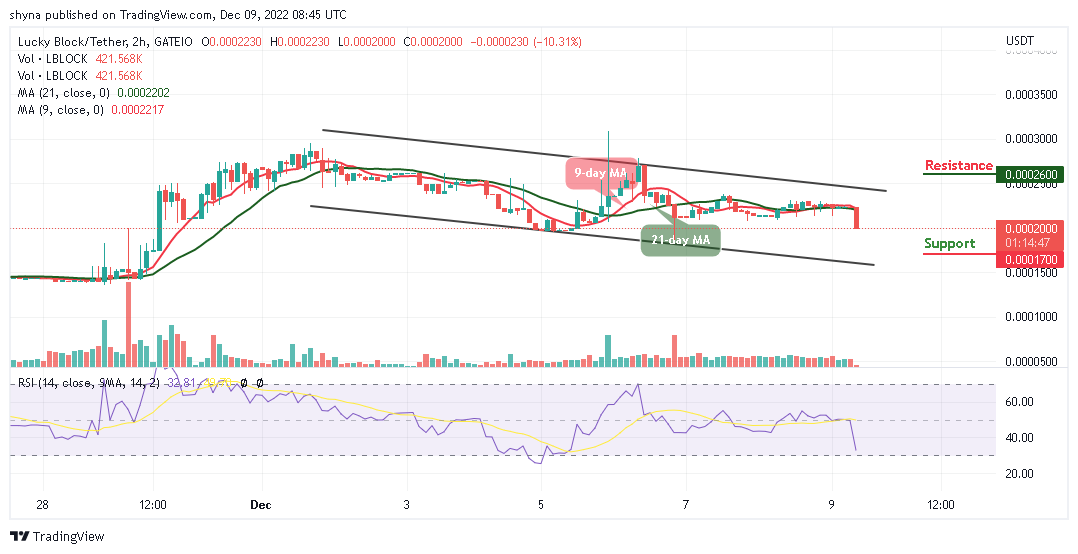
However, if the buyers push the price above the resistance level of $0.000220, higher resistance could be located at $0.000235 and above while the technical indicator Relative Strength Index (14) moves below the 40-level, indicating that the coin may consolidate before moving higher. Moreover, should the bulls fail to move higher, the bears may step back into the market, and the nearest support level could be located at $0.000195 and below.
You can purchase Lucky Block here. Buy LBLOCK