Lucky Block Price Prediction: LBLOCK/USD Reclaims $0.000220 Level; More Buyers Will Surface
Estimated Reading Time: 3 minutes
Don’t invest unless you’re prepared to lose all the money you invest. This is a high-risk investment and you are unlikely to be protected if something goes wrong. Take 2 minutes to learn more
Lucky Block Price Prediction – December 15
The Lucky Block price is recovering to the upside as the coin moves to cross above the upper boundary of the channel to touch the nearest resistance level.
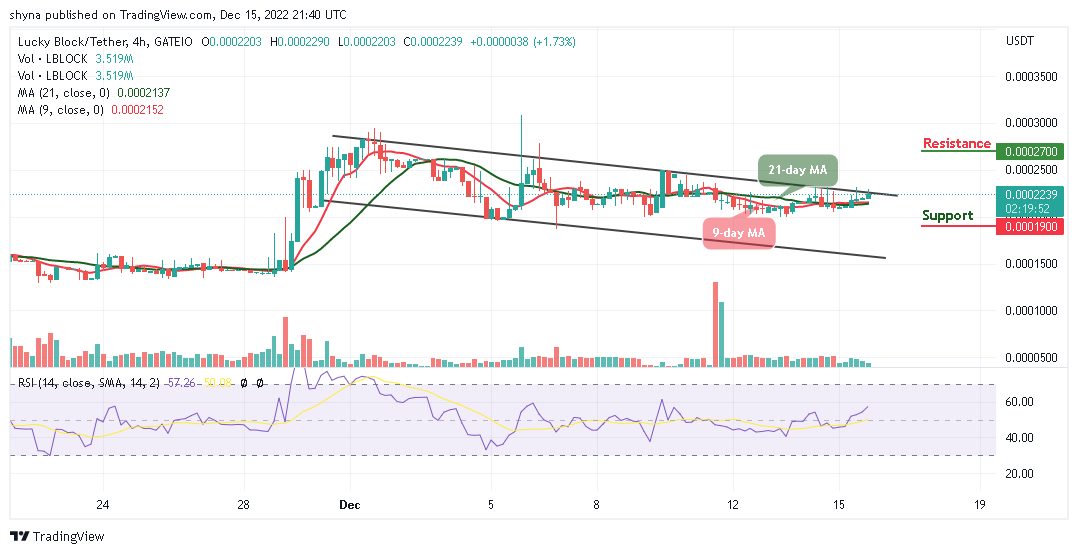
LBLOCK/USD Medium-term Trend: Ranging (4H Chart)
Key Levels:
Resistance levels: $0.000270, $0.000290, $0.000310
Support levels: $0.000190, $0.000170, $0.000150
LBLOCK/USD is following the bullish movement as the coin moves to cross above the upper boundary of the channel. Meanwhile, the market is likely to become low if the coin crosses below the 9-day and 21-day moving averages, this is for the new buyers to enter the market. Moreover, should the bulls fail to push the price to cross above the resistance level of $0.000220, the Lucky block price may retreat again before heading to the north.
Lucky Block Price Prediction: LBLOCK/USD Ready to Spike Higher
The Lucky Block price will once again break above the upper boundary of the channel as the market price hits the resistance level of $0.000229. However, any further bullish movement above this barrier could push the coin to the resistance levels of $0.000270, $0.000290, and $0.000310.
Meanwhile, the upward movement could be delayed if the bears resume back into the market, which could make the coin touch the support levels at $0.000190, $0.000170, and $0.000150. Therefore, the technical indicator Relative Strength Index (14) is likely to cross above the 60-level, preparing the coin for more upward movements.
LBLOCK/USD Medium-term Trend: Bearish (4H Chart)
When compares to the 2-hour chart, the Lucky Block price remains above the 9-day and 21-day moving average, aiming to cross above the upper boundary of the channel. However, if the buyers push the price above this barrier, higher resistance could be located at $0.000250 and above.
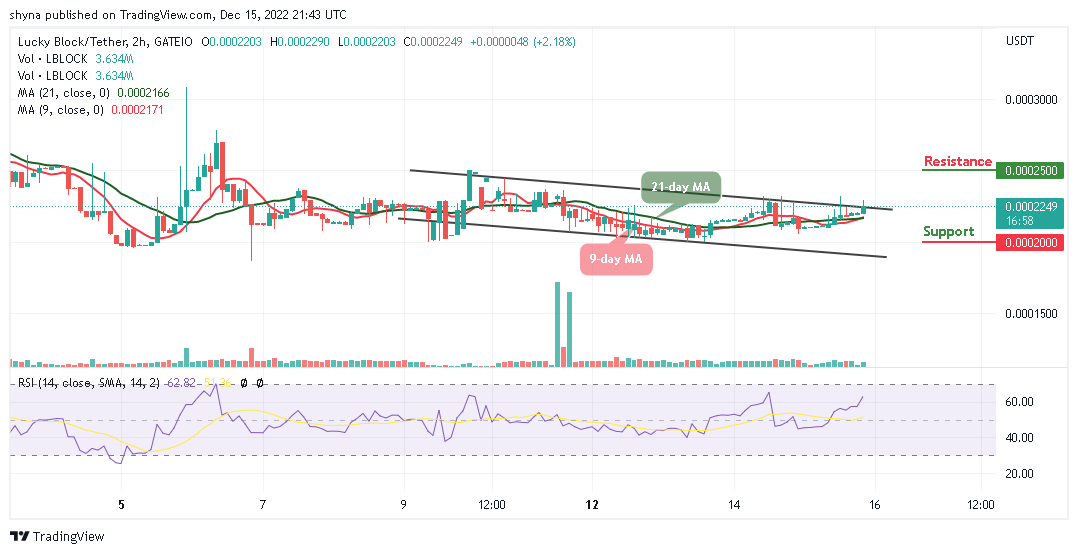
Nevertheless, the technical indicator Relative Strength Index (14) is moving above the 60-level, which indicates that buyers are going to dominate the market. Moreover, should bulls fail to move the current market value above, the bears may step back into the market, and the nearest support level could be found at $0.000200 and below.
You can purchase Lucky Block here. Buy LBLOCK