Price Resolves Downward in 0x (ZRXUSD) Configuration
Estimated Reading Time: 3 minutes
Don’t invest unless you’re prepared to lose all the money you invest. This is a high-risk investment and you are unlikely to be protected if something goes wrong. Take 2 minutes to learn more
ZRXUSD Analysis – Price Resolves Downward From $1.240 Significant Level
Price resolves downward in ZRXUSD market configuration as a result of the bulls’ failure to expand price. The bulls failed to overcome the effect of price movement. The market’s major prospects, buyers and sellers, are engaged in price expansion. As a result of their continued involvement in the market, the price is eventually attained by the bears. The sellers are now established to control the market as a result of the strength applied by them.
ZRXUSD Price Levels:
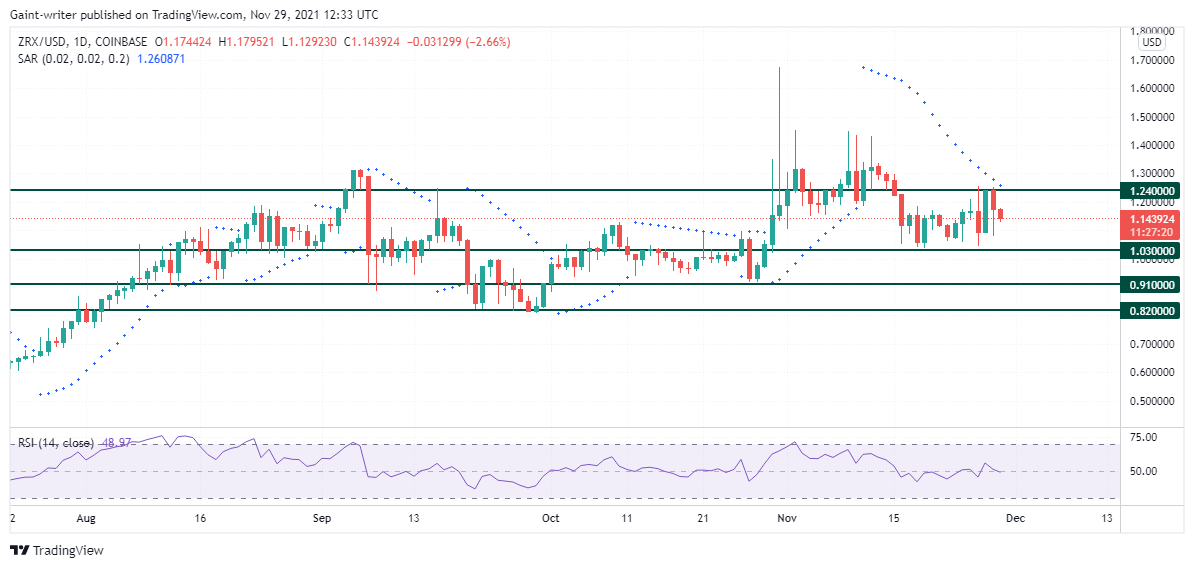
Resistance Levels: $1.240, $1.030
Support Levels: $0.910, $0.820
The configuration of the market shows that the market structure is already directed to a bearish state and the bears are not deterred to resolve the price downward following an increase in the price momentum. This, however, shows the general trend phase of the current demand of price action. The bullish structure in the market was first indicated after a touchdown near the $0.820 level of significance. The bullish strength of the market arose after the touchdown near this crucial level. Due to the price riding upward, the demand experiences several oppositions by the sellers. The bulls eventually took the price level beyond $1.240, where the bullish price movement ended.
The other prospects in the market include sellers who are immersed in the market and causing the price to resolve downward. Their concentration gave strength, as they take full control of the price. The price, however, failed to go below the $1.030 level of significance before the bulls interfered with the structure. Upon the retest at the $1.240 level of significance, the price is now set to go below the $1.1030 level of significance.

Market Expectations
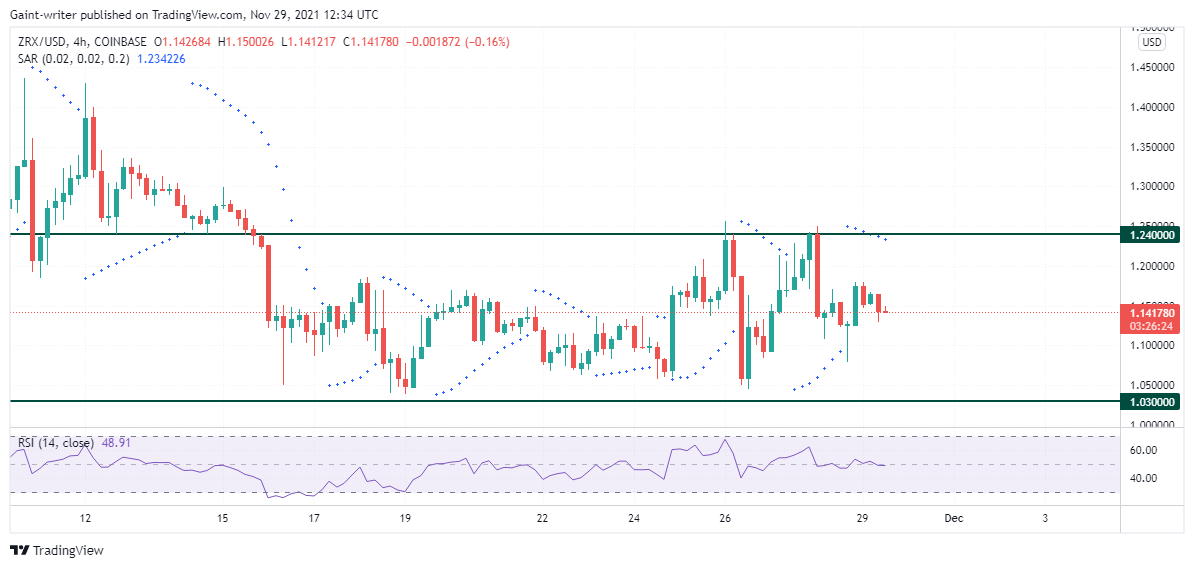
The general direction of the configuration of the market is indicated by the Parabolic SAR (Stop and Reverse). It shows the general bearish direction of the market. The RSI ( Relative strength index) also shows price movement in relation as price resolves downward to $1.030 level.
You can purchase crypto coins here: Buy Tokens
Note: Cryptosignals.org is not a financial advisor. Do your research before investing your funds in any financial asset or presented product or event. We are not responsible for your investing results.