Bitcoin on Flushing Out Over-Leveraged Longs: Willy Woo
Estimated Reading Time: 3 minutes
Don’t invest unless you’re prepared to lose all the money you invest. This is a high-risk investment and you are unlikely to be protected if something goes wrong. Take 2 minutes to learn more
Bitcoin (BTC) remains in a struggle to hold bears off as it fell towards the $46K support on Tuesday in the early Asian session.
The benchmark cryptocurrency has shed over 30% since it printed a new all-time high in November. Interestingly, this is not the worst sell-off this year. Between April and July, BTC plummeted by over 54%, following the COVID-19-induced selloff.
That said, prominent on-chain analyst Willy Woo recently published a heat map that visualized the representation of dip-buying. He noted that: “it has been happening, it’s moderate, but most importantly, as yet there are no signs of a further sell-off cascade.”
Woo (@woonomic) tweeted yesterday that:
“Buying the dip visualised (spot volumes seen on-chain). It has been happening, it’s moderate, but most importantly, as yet, there’s no signs of a further sell-off cascade. Also worth keeping in mind longs have already been flushed.”
Meanwhile, another indicator that leveraged positions (longs) have been “flushed out” is the existing open interest (OI). OI is the measure of the total number of pending derivatives contracts. The derivatives market has played a significant role in Bitcoin’s volatility and rapid declines over the past few years.
Over-leveraged long positions get liquidated quickly, which triggers severe sell-offs for BTC, resulting in double-digit price drops within a short period.
Key Bitcoin Levels to Watch — December 14
BTC remains subdued by bears, as it failed, again, to break above the critical five-week-long descending trendline yesterday. Yesterday’s rejection from the $50K top caused the benchmark cryptocurrency to lose close to $5K, as it touched the $45.6K support. Not surprisingly, this rejection coincides with a retest of the $51.4K – $50.4K pivot zone.
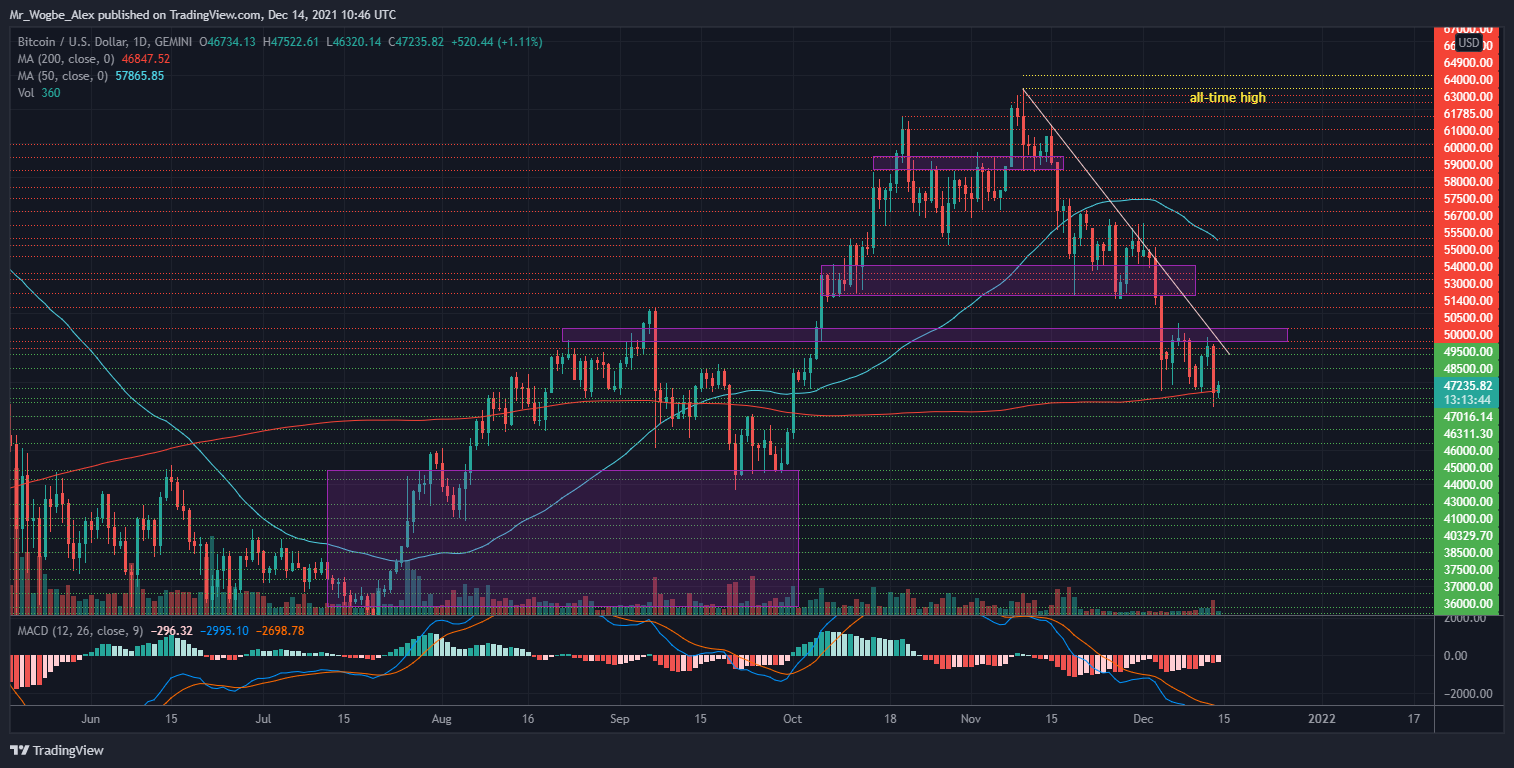
Also, yesterday’s bearish slowdown likely occurred as a result of the 200 SMA support acting on the $46K region. That said, BTC needs to hold its ground above this line (200 SMA) to prevent a bearish continuation in the near term.
Meanwhile, my resistance levels are at $48,500, $49,500, and $50,000, and my key support levels are at $46,300, $46,000, and $45,000.
Total Market Capitalization: $2.15 trillion
Bitcoin Market Capitalization: $889 trillion
Bitcoin Dominance: 41.3%
Market Rank: #1


