Zcash (ZEC/USD) Finds Solid Ground at the $28.00 Price Level
Estimated Reading Time: 2 minutes
Don’t invest unless you’re prepared to lose all the money you invest. This is a high-risk investment and you are unlikely to be protected if something goes wrong. Take 2 minutes to learn more
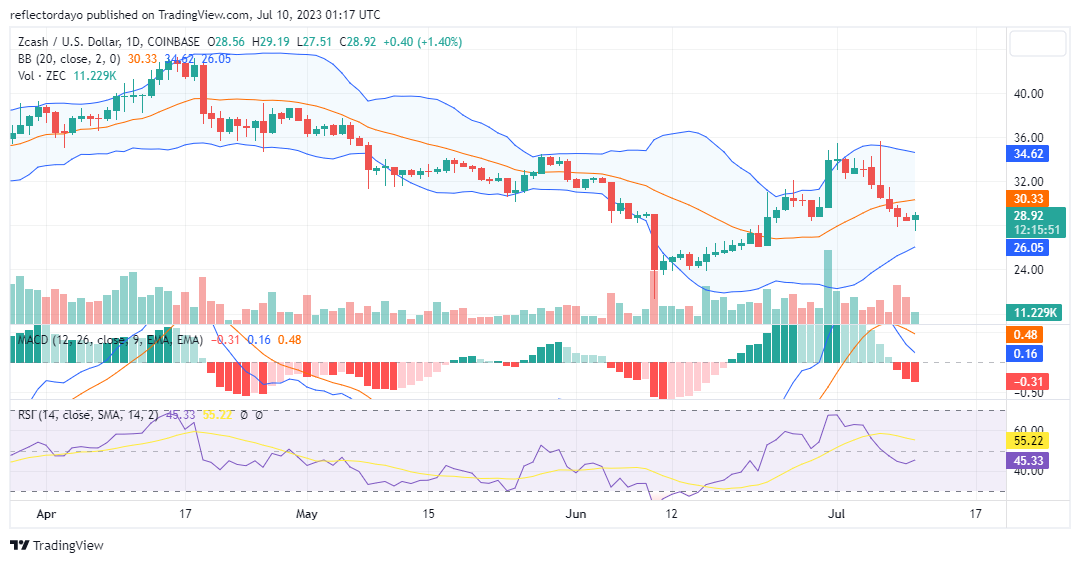
Zcash’s upside journey was triggered on June 10, when the bear market of last month forced the market to a low of $21.32. The bull market gains traction as it reaches higher price levels until it nears the edge of the $36.00 price level. The price retracement from this level seems very strong, judging by the characteristics of the candlesticks. However, the market seems to be turning around at the $28.00 support level.
Zcash Market Data
- ZEC/USD Price Now: $28.59
- ZEC/USD Market Cap: $464,387,111
- ZEC/USD Circulating Supply: 16,328,269 ZEC
- ZEC/USD Total Supply: 16,328,269
- ZEC/USD CoinMarketCap Ranking: #82
Key Levels
- Resistance: $32.00, $34.00, and $36.00.
- Support: $25.00, $23.50, and $20.00.
Price Prediction for Zcash: The Indicators’ Point of View
Although the falling price of the market has found solid ground at the $28.00 price level, as far as the indicators are concerned, the market has fallen into the sell zone. This is because the price retracement has been very significant. The Zcash bulls came in at the $28.00 demand level to salvage the bull market.
Now, the market in the Relative Strength Index is showing signs of a trend reversal as the RSI Curve ranges at a level 43.70. With the appearance of a spinning top candlestick around the crucial demand level, it points to the fact that bullish sentiment is growing and the trend might reverse from here.
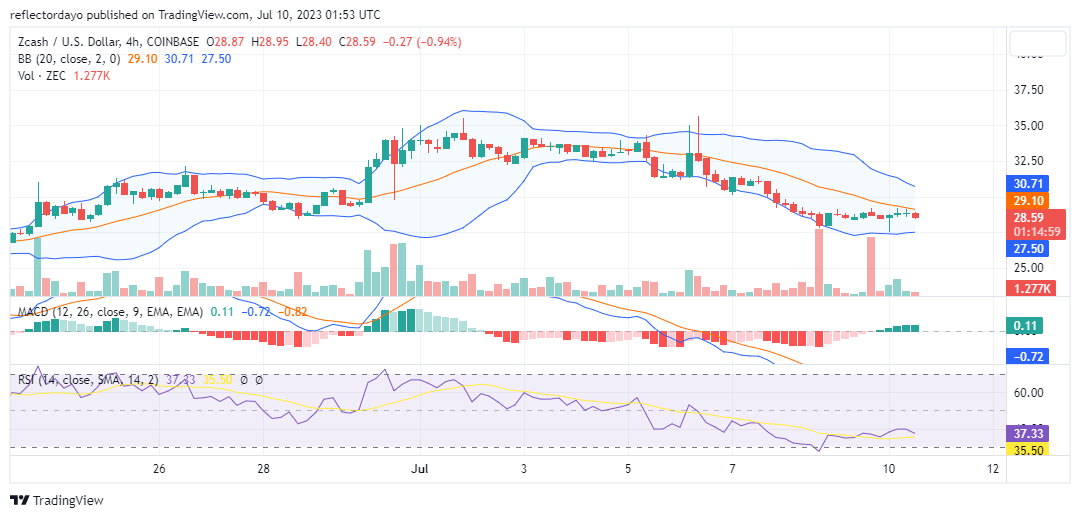
ZEC/USD 4-Hour Chart Outlook
The downtrend in a 4-hour timeframe is evident, as even the Bollinger Bands indicator reflects a downward movement with its two standard deviation curves. However, as the market reached the critical support level at $28.00, the price action shifted to a sideways range. This suggests that the market is consolidating along the edge of this price level, indicating a potential pause in the downward momentum or even a trend reversal. All eyes should be on this price level to monitor new developments and to be able to hop in as the market starts its upside journey.