The Uniswap (UNI/USD) Market Is in an Overbought State, Tending to Drop
Estimated Reading Time: 3 minutes
Don’t invest unless you’re prepared to lose all the money you invest. This is a high-risk investment and you are unlikely to be protected if something goes wrong. Take 2 minutes to learn more
Uniswap Price Prediction – July 21
Over time, buying activities have been prevailing in the UNI/USD market to the point of showcasing that the crypto-economic trade has run into an overbought state and may drop in the subsequent days.
The valuation of the market has been bargaining between the high-value line of $6.3843644 and the major underlying support point of $5.50. However, buyers will have to place under a falling route by correcting and keeping beneath the recent basis stand of around $6. Therefore, bulls would have to put off any desire to make a comeback until after that assumption actually came to pass.
UNI/USD Market
Key Levels:
Resistance levels:$$6.50, $7, $7.50
Support levels: $5.50, $5, $4.50
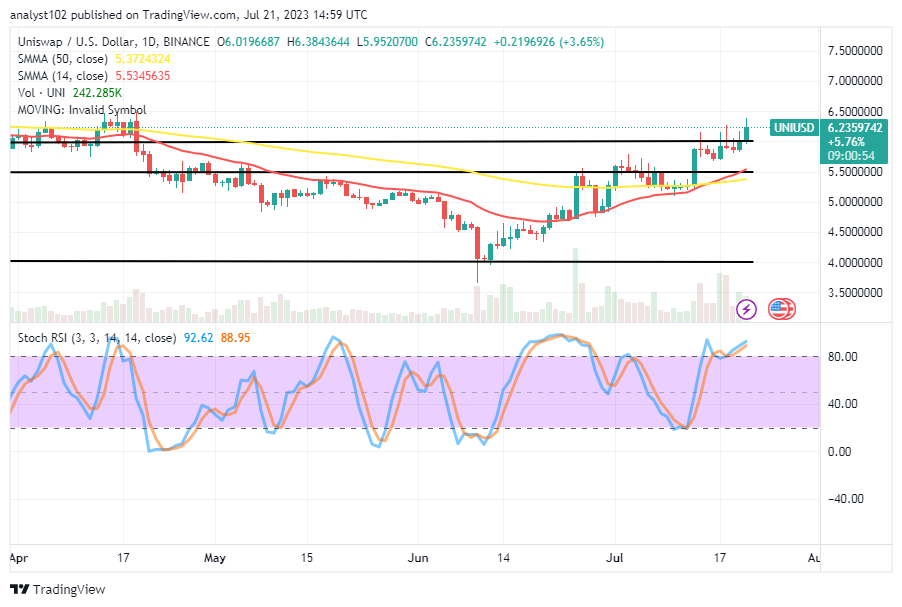
UNI/USD – Daily Chart
The UNI/USD daily chart showcases that the crypto-economic market is in an overbought state and tends to drop against the psychological trading spot of $6.
There are two horizontal lines drawn between $6 and $5.50 to mark the higher points that the most recent roaring transaction moments may eventually fall back into. The 14-day SMA indicator is positioned slightly northward at $5.5345635 across the $5.3724324 value of the 50-day SMA indicator. The Stochastic Oscillators are in the overbought region between 88.95 and 92.62 points. That implies that some abilities to increase their strength have reached a sensitive warning stage to exercise extraordinary caution.
Beyond the $6.50 resistance in the UNI/USD market, are there other forces that sellers must contend with?
By the reading of the technical view indices of this analytics chart, buyers strength in the UNI/USD trade operations has pulled to a peak, confirming that price is in an overbought state and tends to drop consequentially from the beneath of resistance of $6.50.
The notification of the 14-day SMA trend line intercepting the 50-day SMA trend line from the underneath to the north side has left a trait that price might not push fearfully past the line of $5.50 in the near future. And if that presumption plays out positively in accordance with its projection, buyers will need to rejuvenate their way of making money.
Technically speaking, given the southward pushes in the UNI/USD market operations, short-position takers will have to play alongside any possible loss of transaction velocity around $6.50. Active motion bagging rejections have to be spotted before making an entry, and investors may cash out parts of their positions before further forces surface.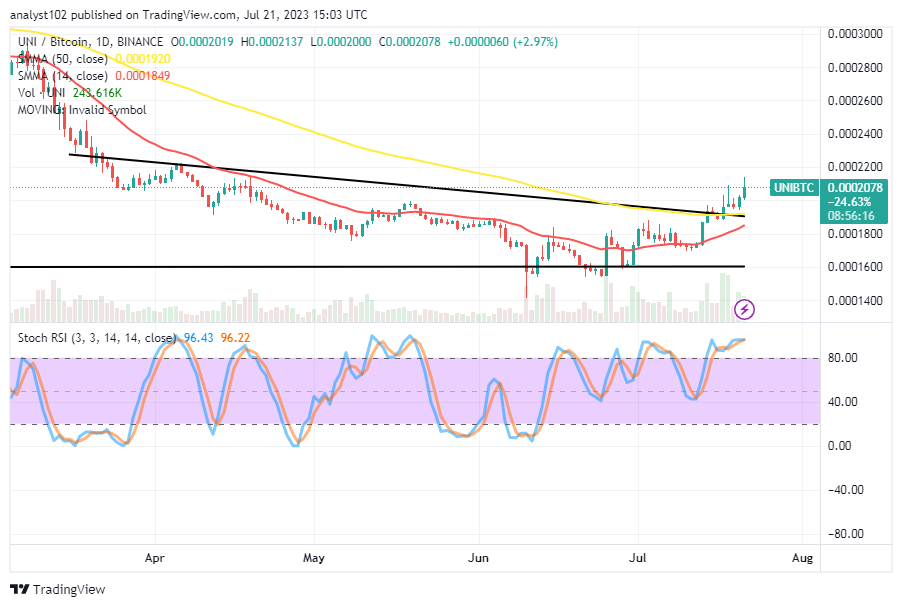
UNI/BTC Price Analysis
In contrast, the Uniswap’s price is in an overbought state and tends to drop from resistances above the indicators.
A daily candlestick will lead the subsequent projected downward motions if it eventually appears at a higher trading resistance zone. The 14-day SMA indicator is in a northward-bending posture toward the line of the 50-day SMA indicator. The Stochastic Oscillators have penetrated the overbought region, keeping points between 96.22 and 96.43. That implies that a necessary retracement has to occur before more surges.
Note: Cryptosignals.org is not a financial advisor. Do your research before investing your funds in any financial asset or presented product or event. We are not responsible for your investing results.
You can purchase Lucky Block here. Buy LBLOCK