DeFi Coin Price Prediction: DEFC/USD Sets to Touch $0.12 Resistance
Estimated Reading Time: 2 minutes
Don’t invest unless you’re prepared to lose all the money you invest. This is a high-risk investment and you are unlikely to be protected if something goes wrong. Take 2 minutes to learn more

Free Crypto Signals Channel
The DeFi Coin price prediction shows DEFC crossing above the 9-day and 21-day moving averages as the coin trades at the $0.11 level.
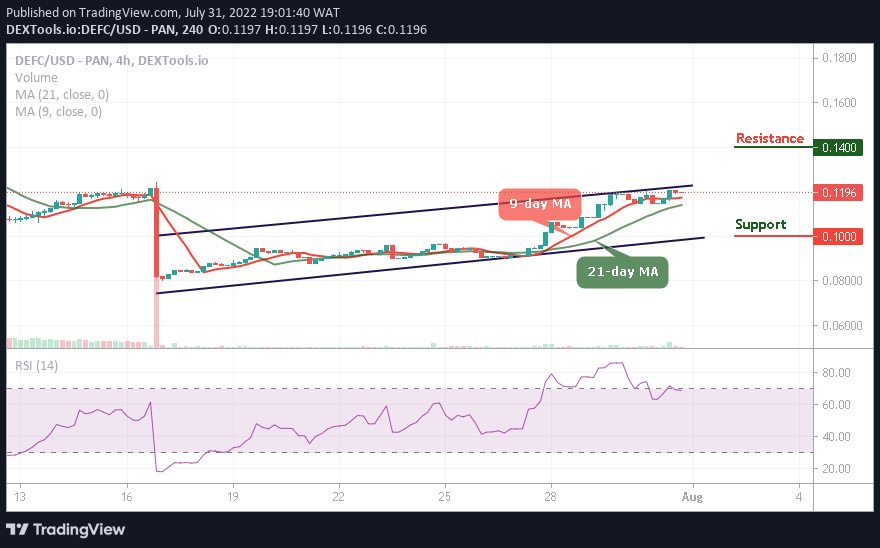
DEFC/USD Long-term Trend: Ranging (4H Chart)
Key Levels:
Resistance levels: $0.14, $0.15, $0.16
Support levels: $0.10, $0.08, $0.06
DEFC/USD is ready to hit the $0.12 resistance level as the coin moves to cross above the upper boundary of the channel. However, the DEFC price is currently trading at $0.11, although the coin touches the daily high at $0.12, it could probably retest the $0.11 level before rising higher.
DeFi Coin Price Prediction: DEFC Price Ready for the Higher Levels
The DEFC price is moving to cross above the channel as a break above this barrier could encourage more buyers to increase their pressure, which could hit the resistance levels of $0.14, $0.15, and $0.16. On the downside, if the price breaks below the 9-day and 21-day moving averages, the downside pressure may increase while the next supports may be created around $0.10, $0.08, and $0.06 respectively. The technical indicator Relative Strength Index (14) remains below the 70-level, to allow more buyers to come into the market.
DEFC/USD Medium-term Trend: Bullish (2H Chart)
The DeFi Coin is moving above the 9-day and 21-day moving averages as the coin range bounds. However, a close above the resistance level of $0.12 will encourage the bulls to extend the rally towards the resistance level of $0.14 and above.
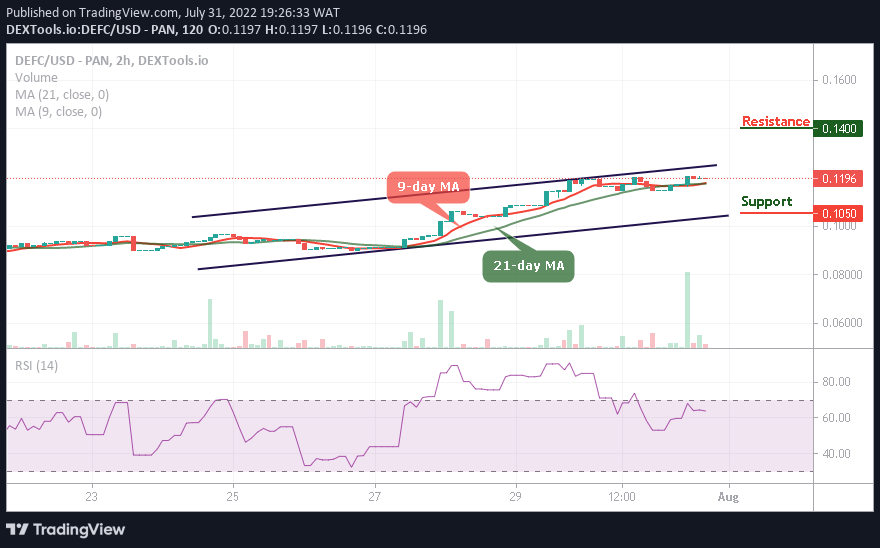
On other hand, a drop towards the lower boundary of the channel could reverse the DEFC price, and a further bearish movement could take the coin to the support level of $0.105 and below. Meanwhile, there is a possibility that the DeFi coin will begin the upward movement as the technical indicator Relative Strength Index (14) ranges above the 60-level.
You can purchase DeFi Coin here. Buy DEFC