Zcash’s (ZEC/USD) Bullish Trend May Be Starting Around $24.25
Estimated Reading Time: 3 minutes
Don’t invest unless you’re prepared to lose all the money you invest. This is a high-risk investment and you are unlikely to be protected if something goes wrong. Take 2 minutes to learn more
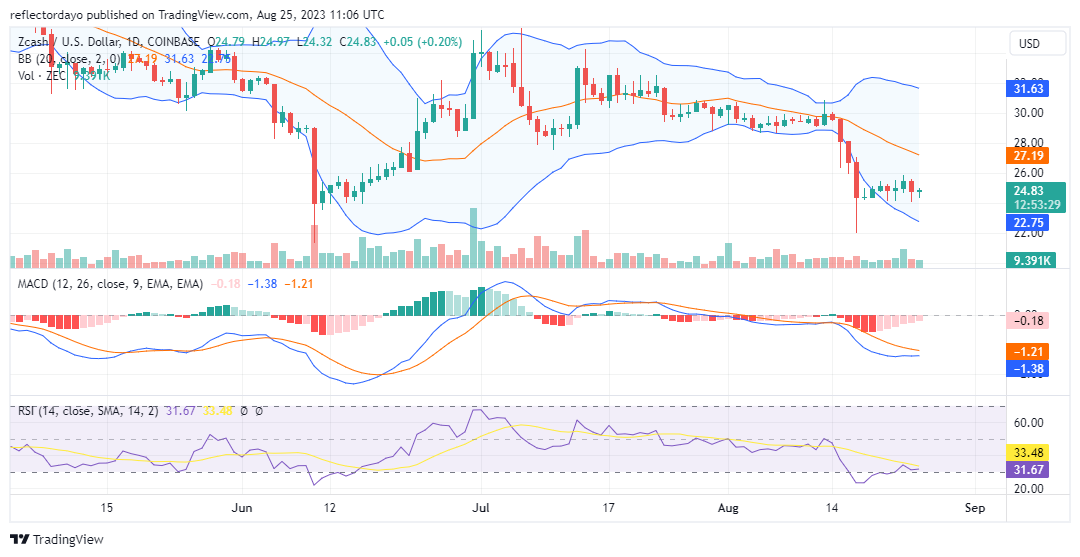
After reaching its peak at $35.67, the market entered a consolidation phase around the $30 price level. This consolidation suggests a period of indecision among Zcash traders as they assess the next potential direction. However, this was followed by a significant downside breakout in mid-August, which drove the price to a low of $22.00.
Subsequently, the market found some stability around $24.39, with price action since August 18 indicating that this level is developing as a support zone. This is a critical observation, as it could indicate a potential shift in market sentiment from bearish to neutral or possibly even bullish.
Zcash Market Data
- ZEC/USD Price Now: $24.80
- ZEC/USD Market Cap: $404,993,209
- ZEC/USD Circulating Supply: 16,328,269 ZEC
- ZEC/USD Total Supply: 16,328,269 ZEC
- ZEC/USD CoinMarketCap Ranking: #78
Key Levels
- Resistance: $27.00, $28.00, and $29.00
- Support: $23.00, $22.00, and $21.00.
Price Prediction for Zcash: The Indicators’ Point of View
The RSI line of the Relative Strength Index, which is currently at 31, indicates that the Zcash market is in oversold territory. This suggests that the recent downward movement might have been excessive and could potentially be followed by a price reversal or a period of consolidation before a new trend emerges. Also, the fact that the market is ranging sideways above the lower standard deviation curve of the Bollinger Bands suggests that volatility has decreased after the recent sharp move. This can be seen as a period of stabilization, possibly hinting at an impending price move. A break above the lower band could indicate a potential reversal or a continuation of the previous trend.
The fading red histograms in the MACD, along with the anticipation of a transition to the positive side, are an indication that the bearish momentum is weakening. A transition from negative to positive histograms often suggests a potential shift from a bearish phase to a bullish phase. This could coincide with a possible price reversal or a period of upward momentum.
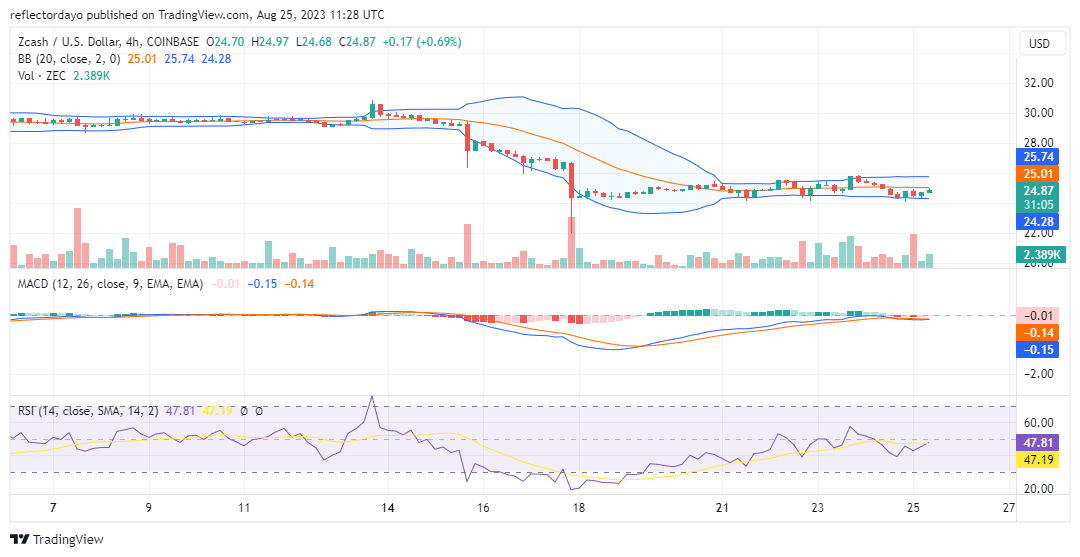
ZEC/USD 4-Hour Chart Outlook
On the 4-hour chart, the Zcash market has settled into a narrow price range, even though the volume of trade indicator reflects a fairly active participation of both buyers and sellers since August 23. This might be a sign that a clear price breakout is on the way.
On the daily chart outlook, the consolidation around $30 and subsequent strengthening of support at $24.39 might indicate that the bearish momentum is slowing down. The oversold condition indicated by the RSI and the potential for MACD histograms to transition into positive territory could lead to a reversal in price direction. Traders could watch for a break above the recent consolidation range as a potential entry point for a bullish trade.