Litecoin (LTC/USD) Price May Encounter Resistance at $95
Estimated Reading Time: 3 minutes
Don’t invest unless you’re prepared to lose all the money you invest. This is a high-risk investment and you are unlikely to be protected if something goes wrong. Take 2 minutes to learn more
Litecoin Price Prediction – May 30
The Litecoin price may encounter resistance at the $95 line against the US currency following its ability to swing back from the support spot of $85 in the last operations. Today’s transaction sessions have featured between the high and the low-value lines of $91.601579 and $90.589008 at a minute positive percentage rate of 0.69. As long as a line around $88.30 is not broken southerly, the upside path features will be on the long-term running.
LTC/USD Market
Key Levels:
Resistance levels: $100, $105, $110
Support levels: $85, $80, $75
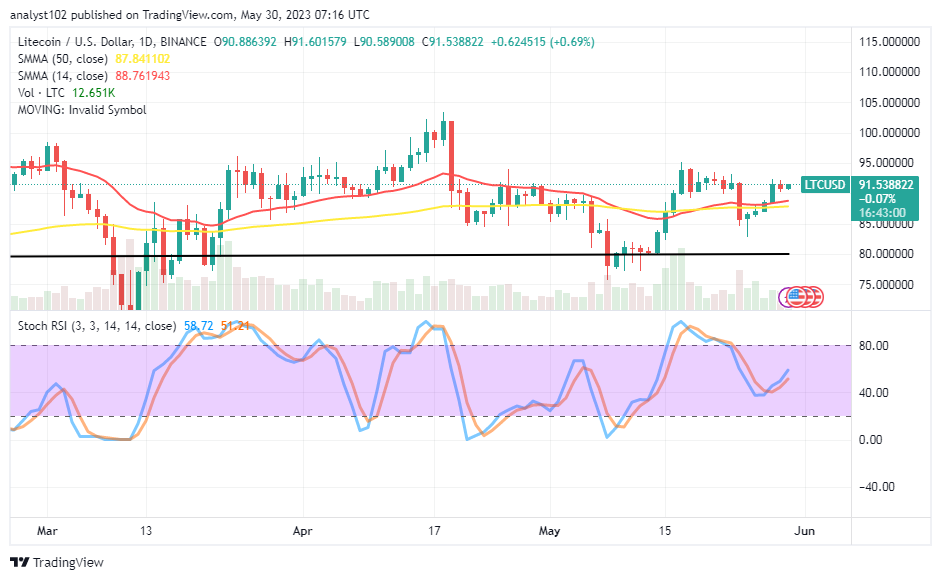
LTC/USD – Daily Chart
The LTC/USD daily chart reveals the crypto-economic price may encounter resistance at $95 over the buy signal side of the SMA trend lines. The 14-day SMA indicator is at $88.761943 above the $87.841102 value of the 50-day SMA indicator. The Stochastic Oscillators have formerly traversed southbound to the 40 before trying to cross back northbound to place around 51.21 and 58.72. The motion to back the moves further to the north tends to release systemically low.
What trading potential does having low points below the SMA trend lines of the LTC/USD market have?
It would be technically ideal to allow the LTC/USD market activities to visit a resistance level higher than its current trading spot before shorting a position, as the crypto-economic price may encounter resistance at $95. A bullish candlestick that appeared in the market roughly three days ago on the 14-day SMA trend line caused the wall that should be sustained by the following trades. New long-position placers should look at the size of their trade portfolios, not going against the overleveraging principle.
On the devaluation-moving direction of the technical analysis, a fearful drawback of the LTC/USD trade needed to surface purposely to break down the SMA values to open the potential of having low points beneath it. Selling actions should be carried out after an upward trend has been to allow several price rejections that could use to identify a line of shorting order entries. Therefore, we would wait a few hours to see how the market will respond between $95 and $100 before placing a short order.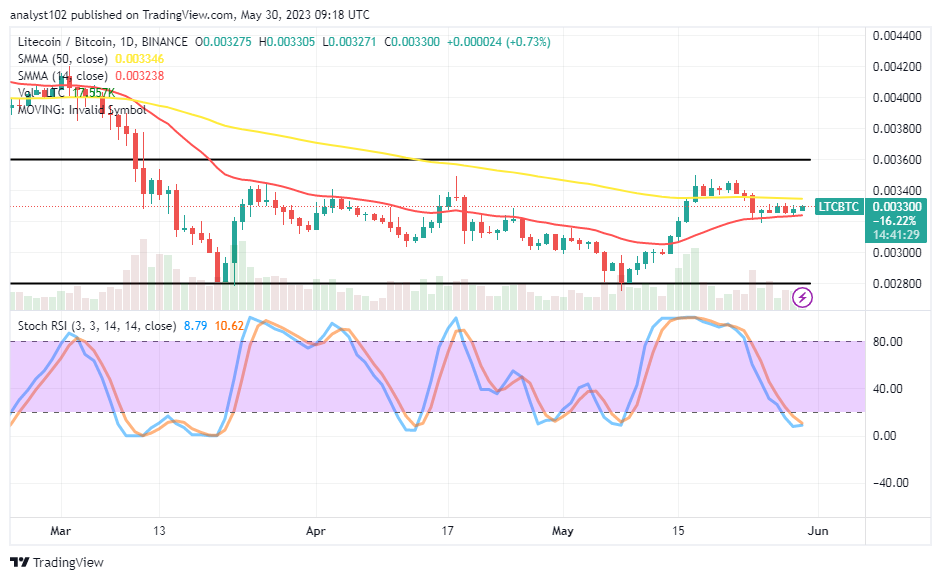
LTC/BTC Price Analysis
In contrast, Litecoin is preparing to encounter resistance at a higher point above the SMA trend lines paring with Bitcoin. The latter trading instrument may lose stances on a lighter-moving mode from a high point of the smaller indicator. The 50-day SMA trend line is over the 14-day SMA trend line. The Stochastic Oscillators are in the oversold region, trying to close at 8.79 and 10.62 to showcase the possibility of seeing a resumption of a rising movement. The base cryptocurrency tends to push up against its counter-trading cryptocurrency shortly to strengthen the assumption for clarity.
Note: Cryptosignals.org is not a financial advisor. Do your research before investing your funds in any financial asset or presented product or event. We are not responsible for your investing results.
You can purchase Lucky Block here. Buy LBLOCK