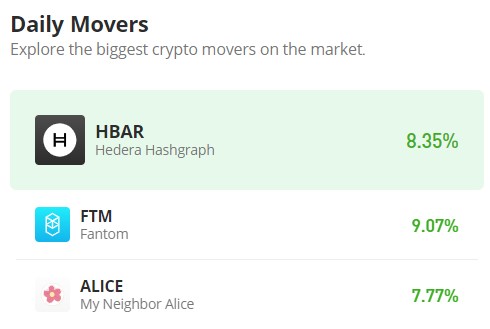
Fantom (FTM/USD) Surges, Nearing December 26th Highs
Estimated Reading Time: 3 minutes
Don’t invest unless you’re prepared to lose all the money you invest. This is a high-risk investment and you are unlikely to be protected if something goes wrong. Take 2 minutes to learn more
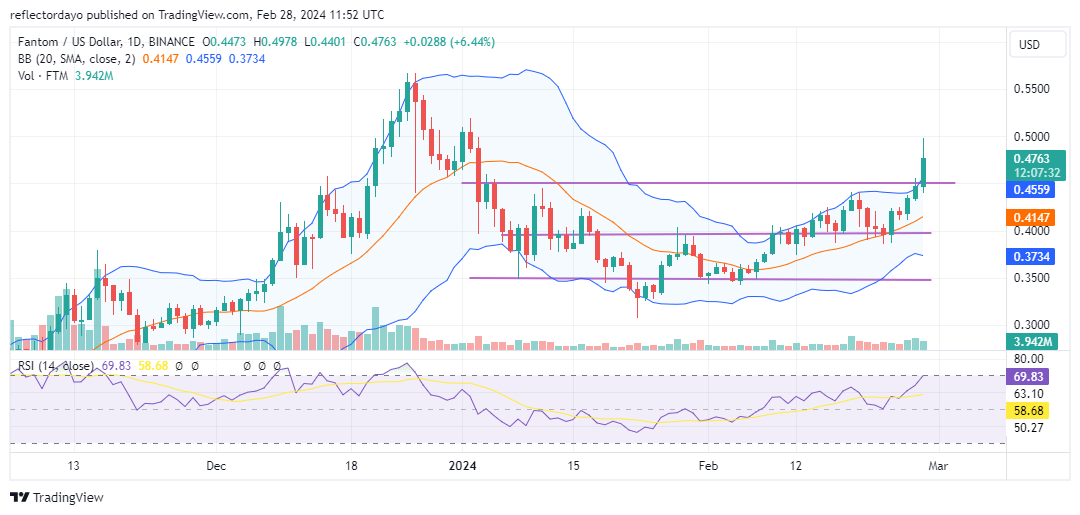
Recently, the Fantom market has experienced upward momentum, with $0.564 emerging as the next target. This level represents a peak reached during the bull run on December 26 of the previous year. Given the recent price movement, there’s a possibility that the market could soon revisit this previous high. However, it’s important to acknowledge that the market is currently encountering resistance at $0.500, which previously acted as a temporary barrier during the last bearish run. Breaking through this resistance level would likely reinforce bullish momentum.
Fantom Market Data
- FTM/USD Price Now: $0.477
- FTM/USD Market Cap: $1.3 billion
- FTM/USD Circulating Supply: 2.8 billion
- FTM/USD Total Supply: 3.2 billion
- FTM/USD CoinMarketCap Ranking: #66
Key Levels
- Resistance: $0.500, $0.525, and $0.550.
- Support: $0.420, $0.400, and $0.350.
Fantom Market Analysis: The Indicators’ Point of View
Taking a historical perspective on the Fantom market’s movement, we observe a surge leading to the $0.40 price level. Here, a notable struggle between supply and demand unfolds, with bearish sentiment causing resistance as the market strives for higher levels. Despite this, bulls ultimately prevail, propelling the price towards the next level.
Anticipating potential challenges at this new price level, we note the upper shadow atop the recent bullish candlestick. This crypto signal is pointing to the possibility of renewed bearish resistance. However, similar to previous instances, bullish momentum may overcome such obstacles.
Of current concern is the volume indicator, which still registers small histograms. Yet, there is optimism that sustained bullish activity could attract more traders, further reinforcing the upward trend.
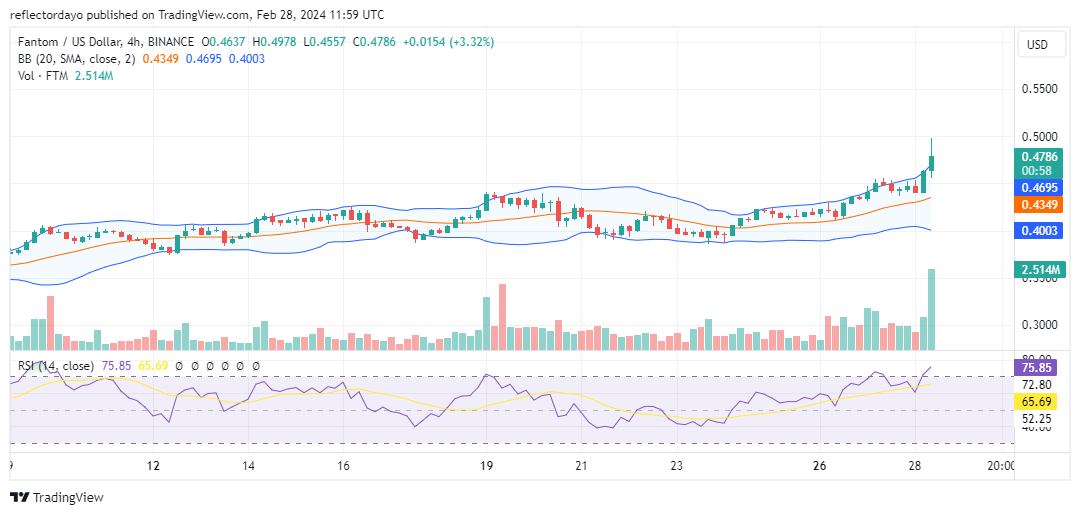
FTM/USD 4-Hour Chart Outlook
Upon analyzing the 1-hour chart of the Fantom market, it becomes apparent that an increasing number of traders are participating in the bull market. However, they encounter significant opposition from those adhering to bearish sentiment, reflected in the tall histogram of the volume of trade indicator. Despite this, bullish dominance persists.
The market trajectory remains upward, although potential resistance looms at the $0.5000 level.