Polkadot Rises but Pauses at the Historical Price Level of $7.70
Estimated Reading Time: 2 minutes
Don’t invest unless you’re prepared to lose all the money you invest. This is a high-risk investment and you are unlikely to be protected if something goes wrong. Take 2 minutes to learn more

Polkadot (DOT) Long-Term Analysis: Bullish
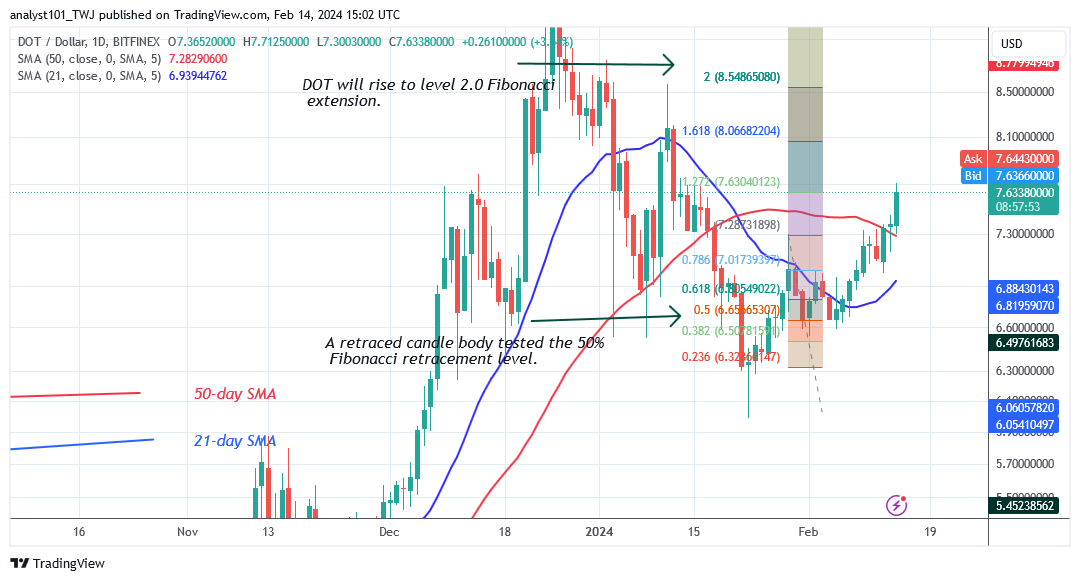
The price of Polkadot (DOT) has broken above the moving average lines but pauses at the historical price level of $7.70. The cryptocurrency asset has risen to a high of $7.70 as of this writing. On the upside, the price indicator predicts that DOT will increase to the 2.0 Fibonacci extension or $8.50 price level.
Currently, the price movement has encountered a resistance level of $7.70, which is the historical price level of January 14, 2024. However, since January 14, 2024, buyers have not exceeded the $7.70 high. Polkadot may begin a sideways move above the moving average lines but below the barrier at $7.70. That is if the alternative coin faces rejection at the recent high.
Technical indicators:
Major Resistance Levels – $10, $12, $14
Major Support Levels – $8, $6, $4
Polkadot (DOT) Indicator Analysis
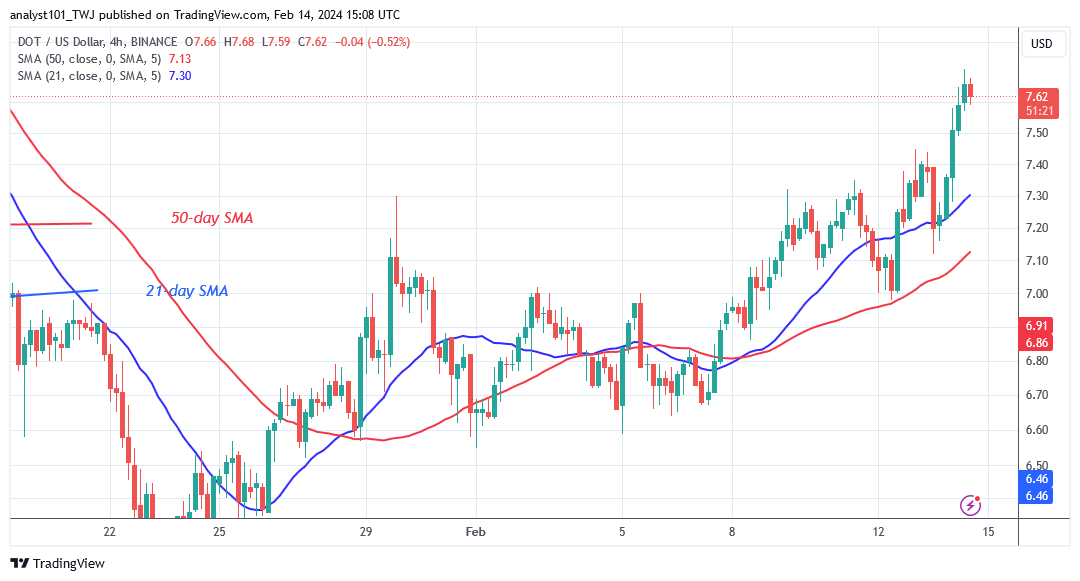
Following the price rebound, the price bars returned above the moving average lines. This has propelled the altcoin to continue its advance while remaining above the moving average lines. On the 4-hour chart, the moving average lines are sloping northward, indicating an uptrend.
What Is the Next Direction for Polkadot (DOT)?
Polkadot’s 4-hour chart shows an upswing but pauses at the historical price level of $7.70. The upswing is stalled around the $7.70 high. Following its inability to break above the current high, the cryptocurrency’s price has fluctuated below it. Nonetheless, once Polkadot enters the overbought region, the crypto signal will turn negative.
You can purchase Lucky Block here. Buy LBLOCK
Note: Cryptosignals.org is not a financial advisor. Do your research before investing your funds in any financial asset or presented product or event. We are not responsible for your investing results