Polkadot Resumes Bullish Ascent as It Battles the $7.00 High
Estimated Reading Time: 2 minutes
Don’t invest unless you’re prepared to lose all the money you invest. This is a high-risk investment and you are unlikely to be protected if something goes wrong. Take 2 minutes to learn more

Polkadot (DOT) Long-Term Analysis: Bearish
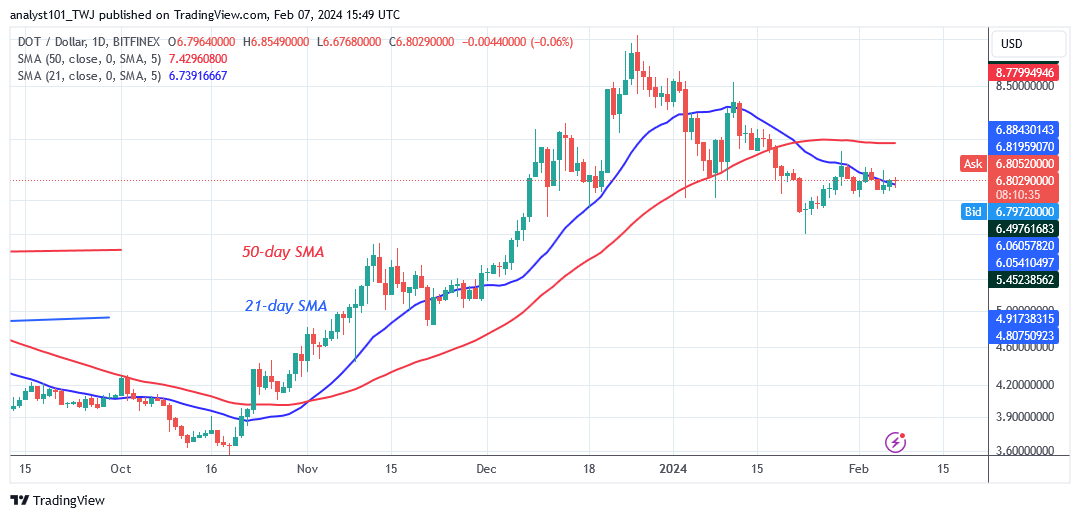
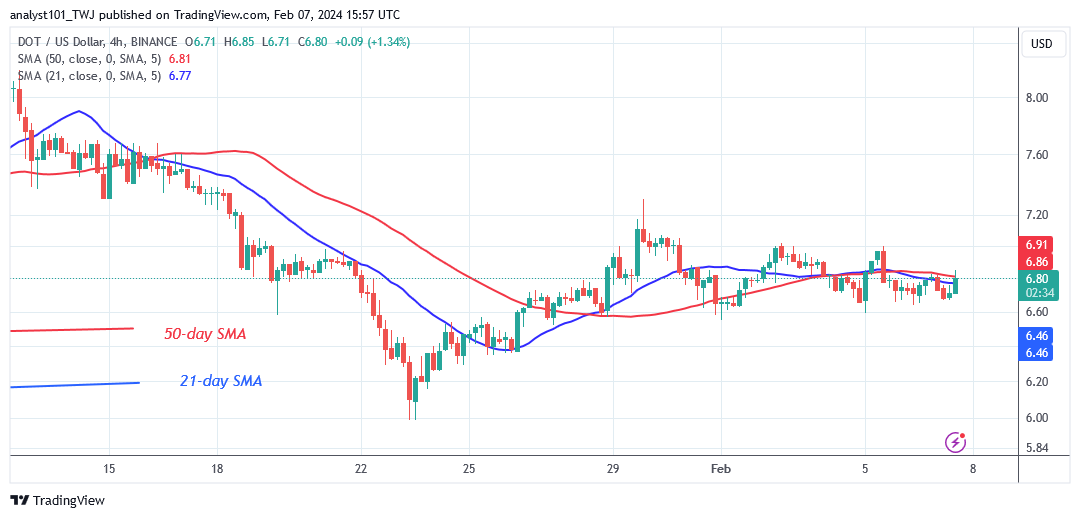
Polkadot (DOT) is above the $6.30 support as it battles the $7.00 high. Bulls bought the dips when the altcoin hit a $5.99 low. The upward corrective only lasted a brief while, peaking at $7.29. The moving average lines prevent the rising movements. The altcoin is currently trading below the moving average lines but above the current support of $6.30.
On the upside, buyers are still frantically trying to hold the price above the moving average line. Today, the cryptocurrency price broke above the 21-day SMA. The positive momentum is projected to continue above the 50-day SMA or $7.50 high. However, if the bullish scenario is invalidated, the altcoin will continue to trade sideways, above the present support at $6.30 but below the moving averages.
Technical indicators:
Major Resistance Levels – $10, $12, $14
Major Support Levels – $8, $6, $4
Polkadot (DOT) Indicator Analysis
The crypto’s price has risen above the 21-day SMA as it battles the $7.00 high. The positive trend will restart if the price rises above the 50-day SMA resistance. If the cryptocurrency price does not break above the 50-day SMA, it will be trapped. Doji candlesticks are also used to characterize price activity.
What Is the Next Direction for Polkadot (DOT)?
Polkadot has recovered bullish momentum, breaking above the 21-day SMA. In recent weeks, upward movements have been hampered by resistance at $7.00.On the upside, the crypto signal will remain optimistic once the $7.00 resistance level and the 50-day SMA are breached. However, the dominance of Doji candlesticks influences price movement.
You can purchase Lucky Block here. Buy LBLOCK
Note: Cryptosignals.org is not a financial advisor. Do your research before investing your funds in any financial asset or presented product or event. We are not responsible for your investing results