Ripple (XRP) Slumps to $1.09 Low, Resumes Uptrend
Estimated Reading Time: 2 minutes
Don’t invest unless you’re prepared to lose all the money you invest. This is a high-risk investment and you are unlikely to be protected if something goes wrong. Take 2 minutes to learn more
Ripple (XRP) Long-Term Analysis: Bullish
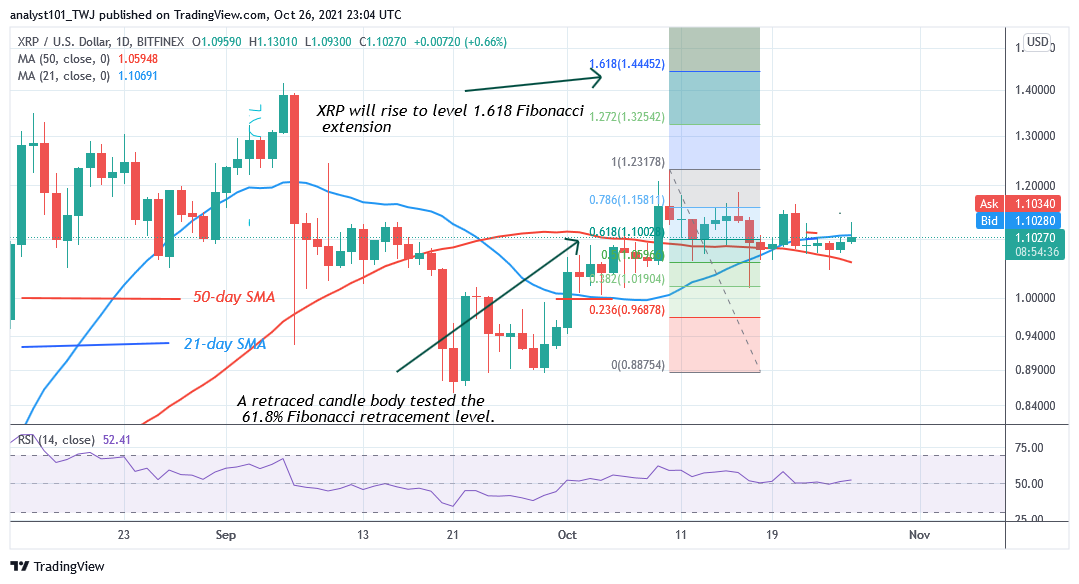
Since October 10, Ripple’s (XRP) price has been consolidating above the moving averages. The upward move has been resisted at the $1.20 high. The bears are attempting to break below the moving averages but there is a pullback. Meanwhile, on October 10 uptrend; a retraced candle body tested the 61.8% Fibonacci retracement level. The retracement indicates that XRP price will rise to level 1.618 Fibonacci extension or $1.44.
Ripple (XRP) Indicator Analysis
Ripple is at level 52 of the Relative Strength Index period 14. The cryptocurrency is in the uptrend zone and above the centerline 50. The 21-day and the 50-day SMAs are sloping horizontally indicating the sideways move. XRP is above the 40% area of the daily stochastic. The altcoin has resumed bullish momentum.
Technical indicators:
Major Resistance Levels – $2.00, $2.50, $3.00
Major Support Levels – $1.50, $1.00, $0.50
What Is the Next Direction for Ripple (XRP)
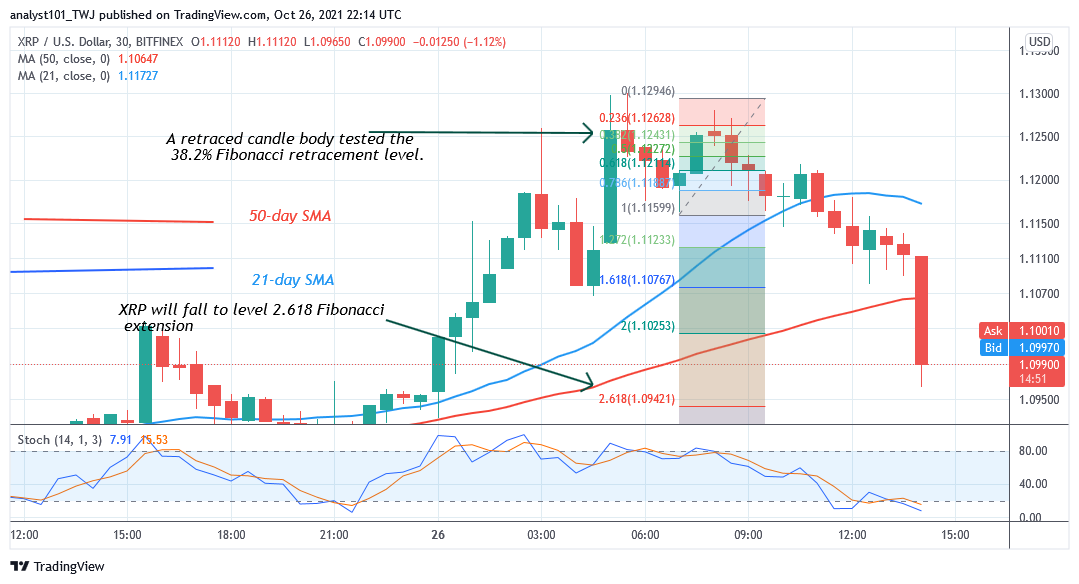
On the 30 minutes chart, Ripple is in a downward move
as price breaks below the moving averages. Meanwhile, on October 26 downtrend; a retraced candle body tested the 38.2% Fibonacci retracement level. The retracement indicates that XRP price will fall to level 2.618 Fibonacci extensions or $1.09. From the price action, Ripple price has fallen and tested the 2.618 Fibonacci extensions or $1.09. The altcoin has resumed an upward move.
You can purchase crypto coins here. Buy Tokens
Note: Cryptosignals.org is not a financial advisor. Do your research before investing your funds in any financial asset or presented product or event. We are not responsible for your investing results