Solana (SOL) Price Prediction: SOL/USDT Weakly Bounces off the $120 Baseline
Estimated Reading Time: 2 minutes
Don’t invest unless you’re prepared to lose all the money you invest. This is a high-risk investment and you are unlikely to be protected if something goes wrong. Take 2 minutes to learn more

Date: January 2, 2026
The Solana market has been underperforming for quite some time. This phase began around mid-September and has largely persisted until now. However, price action has recently bounced off the $120 support level, prompting a closer look at current market conditions.
Long-Term Trend — Bullish (Daily Chart)
Key Price Levels
Resistance: $130, $140, $160
Support: $125, $120, $115
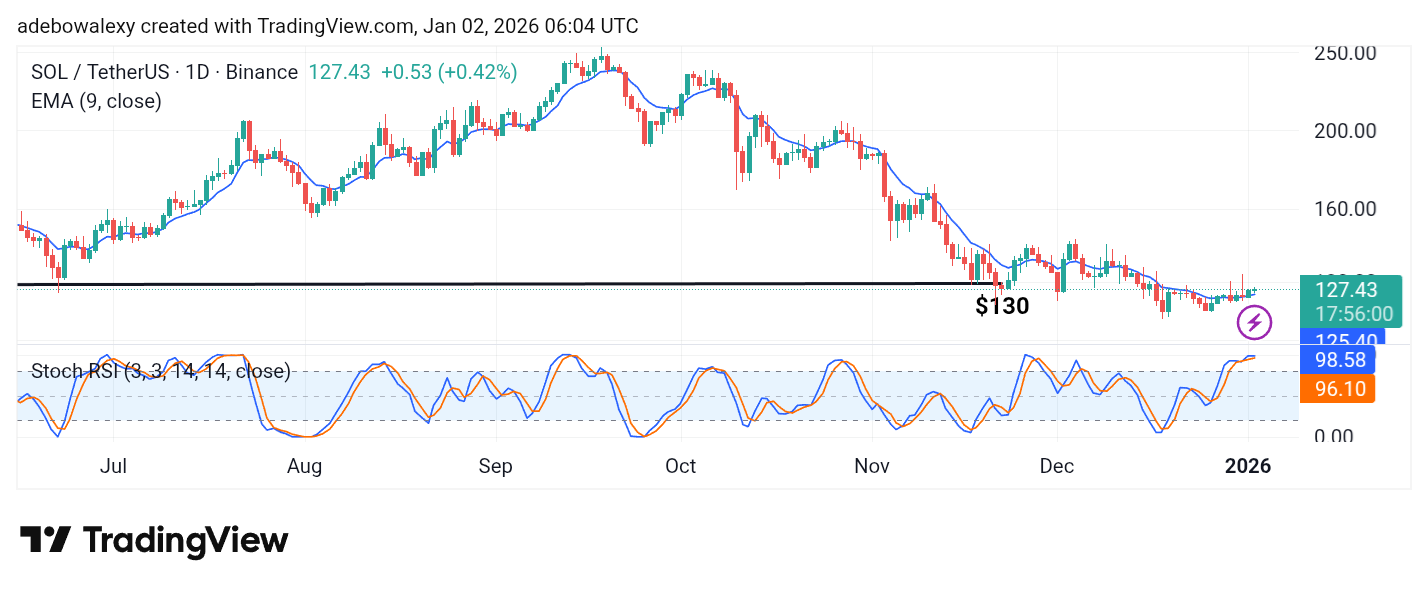
On the daily chart, price action remains above the 9-day Exponential Moving Average (EMA). The most recent price candle has also closed green. Meanwhile, the Stochastic Relative Strength Index (SRSI) lines have pushed deep into the overbought region, signaling stretched bullish momentum.
Solana (SOL) Price Prediction: Bears Still Hold the Upper Hand
Although price action has climbed above the 9-day EMA on the Solana daily chart, the upward movement appears weak. The SRSI lines are already positioned in overbought territory, suggesting limited room for further upside.
Additionally, the most recent price candle has a relatively small body, indicating fading momentum. As a result, the move above the 9-day EMA may lack sustainability, increasing the likelihood of a renewed downward move.
Solana (SOL) Price Prediction: SOL/USDT Signals a Possible Retreat Below the EMA (4-Hour Chart)
As suggested by the daily chart, the Solana market is already showing signs of renewed bearish pressure during the ongoing session.
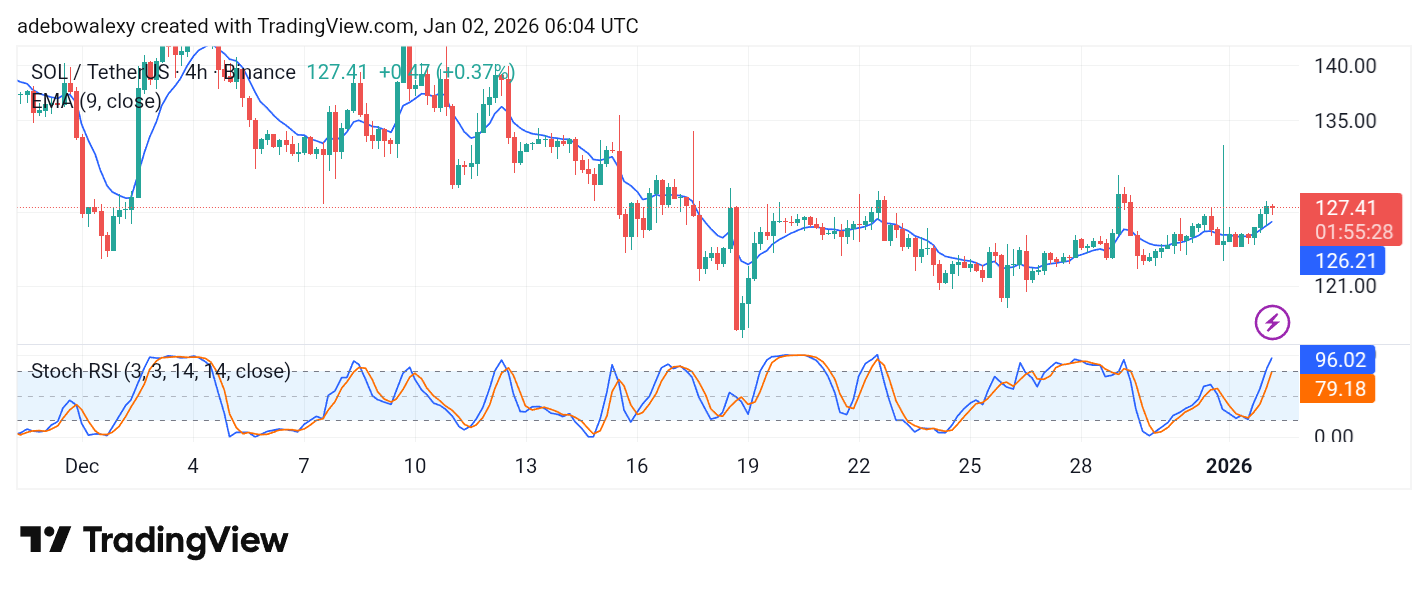
The latest price candle on the 4-hour chart has turned red. Meanwhile, the SRSI lines continue to trend higher, with the lead line already above the 90 level.
This elevated SRSI reading appears exaggerated relative to the modest price movement observed. Consequently, bullish momentum may soon fade, increasing the probability of a pullback toward the $125 and $120 support levels.