$SPONGE (SPONGE/USD): Poised to Rally As Bulls Flex Their Muscle?
Estimated Reading Time: 3 minutes
Don’t invest unless you’re prepared to lose all the money you invest. This is a high-risk investment and you are unlikely to be protected if something goes wrong. Take 2 minutes to learn more

The price of $SPONGE has been stuck in a tug-of-war between buyers and sellers, stuck between $0.00004 and $0.00005 for a while. Lately, there’s been a bit of a downward nudge, with some testing the levels below $0.00004. But here’s the interesting part: each time it dips, it bounces back up. This crypto signal could be a sign that bulls are getting ready to push things higher and potentially establish a new floor above $0.00005.
Key Market Dynamics:
- Resistance Levels: $0.0010, $0.0011, and $0.0012.
- Support Levels: $0.000035, $0.000030, and $0.000025.
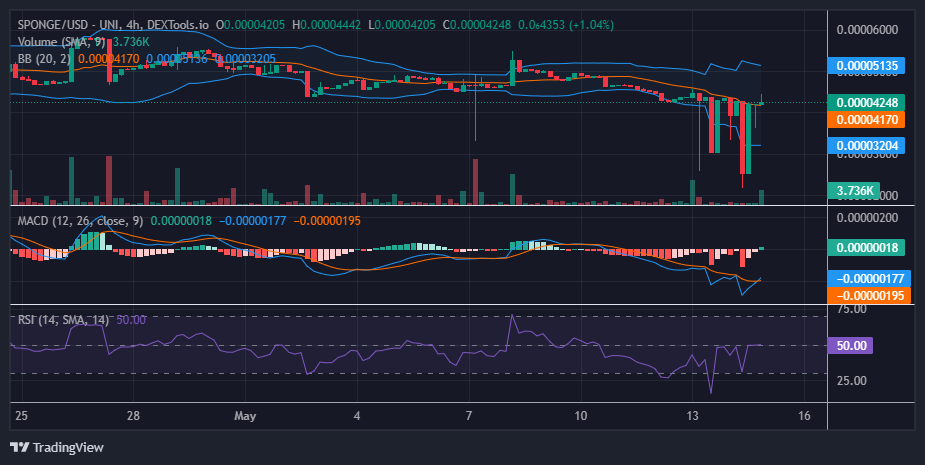
Delving into Technical Analysis for $SPONGE (SPONGE/USD)
Here are indications that bullish forces are exerting pressure on the market, albeit encountering significant bearish resistance. During the most recent 4-hour session, a robust bullish volume histogram was observed on the chart, reflecting substantial trading activity within that timeframe. However, conversely, the actual candlestick failed to make significant progress in either a bullish or bearish direction, apart from the lower shadow present on the candlestick.
The current trading session, characterized by a candlestick with a notable upper shadow, signifies the presence of bearish sentiment, which has constrained the market to its current price level of $0.000042. Indicators continue to suggest a market in a state of equilibrium. However, the Moving Average Convergence and Divergence (MACD) indicator has recently signaled a bullish crossover. This suggests that buyers are gaining ground, potentially paving the way for an imminent breakout as bullish momentum gathers strength.
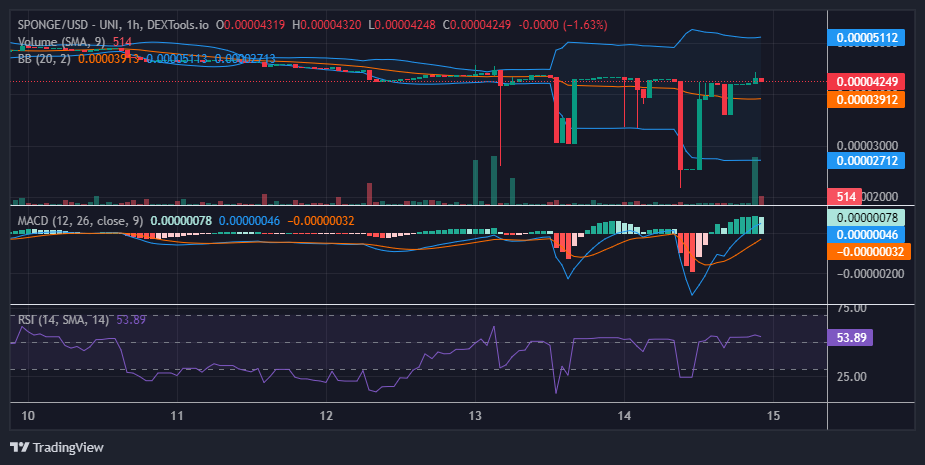
Insights from the 1-Hour Perspective
Upon closer examination of the one-hour chart, $SPONGE appears to be initiating its position around $0.000042, with indications of bullish activity emerging. Buyers are actively driving the market, resulting in a slight divergence from the equilibrium level. The succession of higher lows, indicated by the lower shadows, along with a subtle shift in price action away from the midpoint, could suggest the potential for a breakout.
The Bollinger Bands, serving as measures of volatility, currently exhibit width owing to recent price fluctuations. This volatility may subside as buyers and sellers converge on a new price range. Should this trend persist, a significant upward rebound could be anticipated.
Buy SPONGE/USD market!
POV: You’re into #Crypto but you don’t hold any $SPONGE 🧽 💦 #SpongeV2 #WAGMI #100x #PEPE pic.twitter.com/Ux1a4yZrXt
— $SPONGE (@spongeoneth) May 14, 2024
Invest in the hottest and best meme coin. Buy Sponge ($SPONGE) today!