Wall Street Memes (WSM) Trade Seller Loses, Bulls Hold Strongly
Estimated Reading Time: 3 minutes
Don’t invest unless you’re prepared to lose all the money you invest. This is a high-risk investment and you are unlikely to be protected if something goes wrong. Take 2 minutes to learn more

Wall Street Memes Price Prediction – August 26
The market financial situation, making ups and downs in the pairing setup of Wall Street Memes coin against the economic stances of the American currency, has been seen being in the mode of making long-term position takers remain tactfully alerted, as the trade seller loses the basis to make bulls hold strongly.
The diminishing WSM/USD market seller influence alongside strong bullish resilience reflects improving upside prospects. While momentum favors accumulation and potential breakout continuation, traders must remain wary of sudden corrective swings, as confirmation above critical support zones remains essential for validating a sustained upward progression.
WSM/USD Market
Key Levels
Resistance levels: $0.0007, $0.0008, $0.0009
Support levels: $0.0005, $0.0004, $0.0003
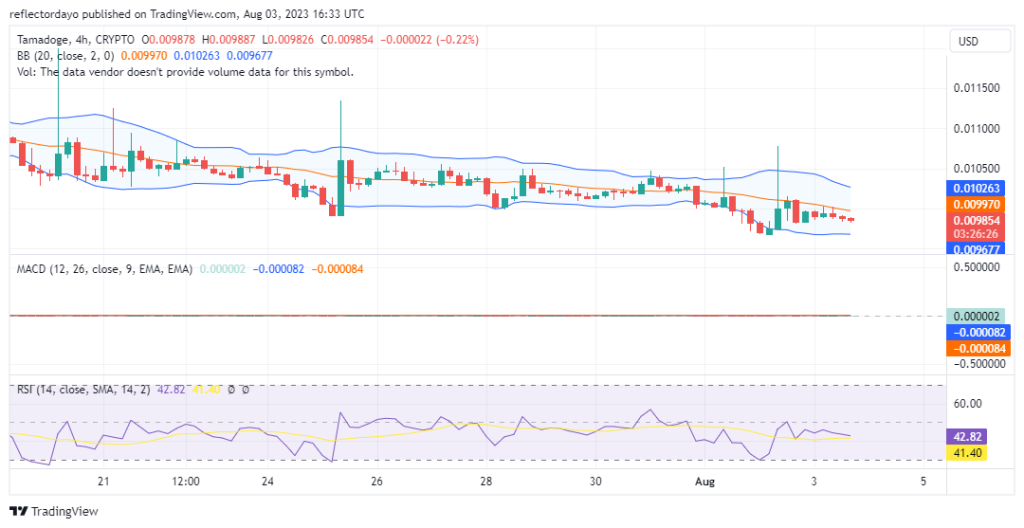
WSM/USD – 4-hour Chart
The WSM/USD medium-term chart reflects the underlying crypto-economic structure, with trade sellers losing ground as bulls maintain strong dominance in their positioning style.
The stochastic oscillators have free prolongation of swings, making bullish signal notes relevant and indicative. The Bollinger Bands are stretching sideways basically around the value line of $0.0006, while gradually making $0.00055 a consolidative support zone against further downside pressure.
Will WSM/USD Sustain Bullish Dominance as Sellers Weaken Within the Underlying Crypto-Economic Structural Framework?
The medium-term structure of WSM/USD suggests weakening seller influence while strengthening bullish positioning, with oscillators hinting at sustained upward momentum if key support levels continue to hold firmly.
This evolving setup reflects growing market confidence, as buyers steadily consolidate their footing against fading bearish pressure. A sustained defense of critical support zones could further amplify upside potential, aligning technical sentiment toward a continuation of the bullish market trajectory.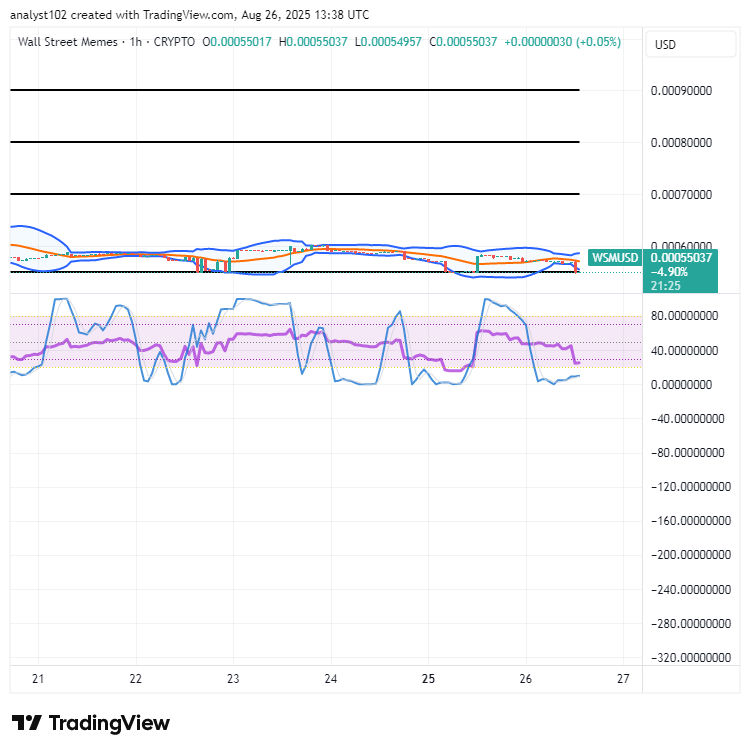
WSM/USD 1-hour chart
The 1-hour chart of the WSM/USD market showcases the trade seller losing the baseline and the bulls holding strongly.
The Bollinger Bands are gradually expanding southward in a preparatory manner, often preceding the early emergence of a potential bullish candlestick formation. The stochastic oscillators have swung southbound into the oversold region, clearly indicating that buying forces are steadily in the increasing mode.
WSM supporters, your voices reached us!
You can now trade $WSM/$USDT directly on #Bybit Perpetuals.
$WSM community, we saw your Tweets! 👏$WSM / $USDT is now tradeable on #Bybit Perpetuals.
— Bybit (@Bybit_Official) October 13, 2023
Trade here: https://t.co/le4XyVyXaZ
Also want your project listed? Share your suggestions here:https://t.co/W7EWJVVNV5 https://t.co/XgXoL7g0rF