Wall Street Memes (WSM) Trade Sales Fade, Bull Builds Strength
Estimated Reading Time: 4 minutes
Don’t invest unless you’re prepared to lose all the money you invest. This is a high-risk investment and you are unlikely to be protected if something goes wrong. Take 2 minutes to learn more

Wall Street Memes Price Prediction – August 25
Price actions in Wall Street Memes coin against the US dollar have remained largely consistent in reflecting a dip-preparatory phase, as selling momentum fades while underlying bullish strength gradually builds.
The Wall Street Memes coin’s market activity, paired with the US dollar valuation, is maintaining a stable footing, with buyers’ steadily building conviction. The fading selling momentum and gradual bullish accumulation suggest that sentiment is leaning toward strength. While caution remains warranted against short-lived reactive pullbacks, the overall structure points to improving confidence and the potential for a stronger upside trend to re-emerge.
WSM/USD Market
Key Levels
Resistance levels: $0.0007, $0.0008, $0.0009
Support levels: $0.0005, $0.0004, $0.0003
WSM/USD – 4-hour Chart
The WSM/USD medium-term chart shows the base crypto’s sales are gradually fading, as bull builds strength.
The Bollinger Bands are now witnessing a formidable series of touches at the lower part, giving hope that selling forces are on the verge of exhaustion. The stochastic oscillators are currently tilting southward into the oversold region, reinforcing the potential for the ongoing bearish pressure to conclude shortly and paving the way for a possible reversal.
Will Wall Street Memes Coin Sustain Bullish Accumulation Against USD, or Face Short-term Reactive Pullbacks?
Wall Street Memes Coin shows strengthening bullish accumulation as fading selling pressure supports buyers, though caution is warranted since short-term pullbacks may surface before broader upside momentum firmly establishes, given a report that the crypto-economic trade’s sales are fading gradually, making bull builds strength in the proceedings.
Wall Street Memes Coin reflects growing bullish accumulation, with fading selling pressure consistently supporting buyers, while stochastic oscillators positioned deeply in oversold territory complement strong expectations that short-term pullbacks may soon transition into renewed upside momentum.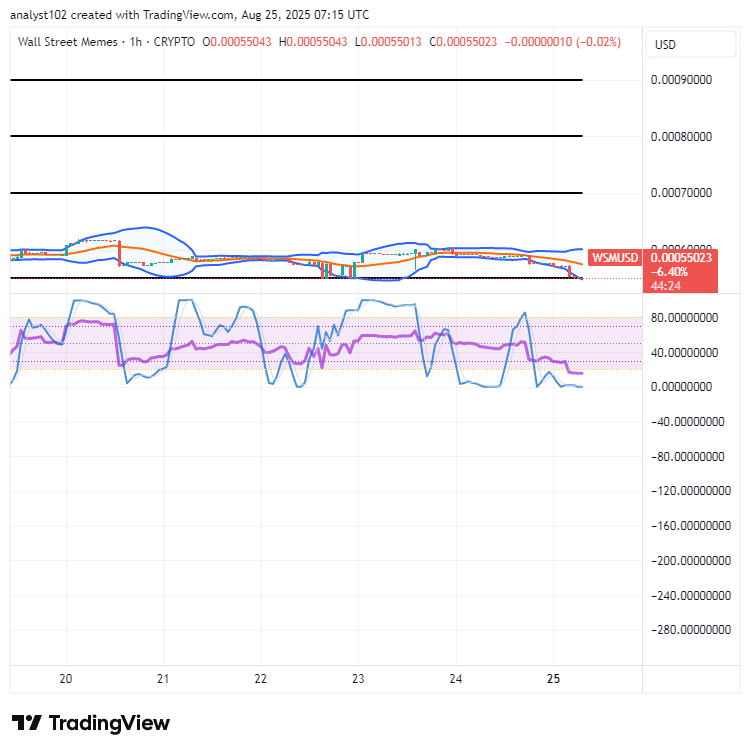
WSM/USD 1-hour chart
The 1-hour chart of the WSM/USD market reveals that the pairing instrument market’s sales are gradually fading, as bull builds strength.
The stochastic oscillators, at present, are lodged in the oversold region, indicating that Wall Street Memes coin has been driven to attractive lower levels, thereby creating ideal entry opportunities for buyers. Meanwhile, the Bollinger Bands are gradually expanding southward in a preparatory manner, often preceding the emergence of a bullish candlestick formation.
BIGTIMEUSDT & WSMUSDT Contracts are now officially live and trading exclusively on Bybit Exchange!
Seize exciting new trading opportunities with powerful 1-25x leverage available for every trader today.
Plus, they’re now seamlessly integrated into the Bybit Futures Grid Bot trading system!
BIGTIME: [https://i.bybit.com/20rabgrK](https://i.bybit.com/20rabgrK)
WSM: [https://i.bybit.com/ab1F9gWH](https://i.bybit.com/ab1F9gWH)
🚀 BIGTIMEUSDT & WSMUSDT Contracts now on Bybit!
— Bybit (@Bybit_Official) October 12, 2023
Dive into new trading opportunities with 1-25x leverage. Plus, they’re now on Bybit Futures Grid Bot! Start trading now.
📈 BIGTIME: https://t.co/FAQlbhnzAh
📈 WSM: https://t.co/pb2y2AfMBE#CryptoTrading #Bybit
Buy and stake WSM now! https://wallstmemes.com/