Wall Street Memes (WSM) Price Is Grounded; Buyers Are Vigilant
Estimated Reading Time: 3 minutes
Don’t invest unless you’re prepared to lose all the money you invest. This is a high-risk investment and you are unlikely to be protected if something goes wrong. Take 2 minutes to learn more

Wall Street Memes Price Prediction – August 23
Physicality and mentality: it is becoming increasingly evident that long-term positioning, aligned with dip-buying strategies, is set to gain traction in the aftermath of Wall Street Memes coin’s market activity, and with the prevailing purchasing strength of the US dollar reinforcing sentiment, the broader outlook suggests that the crypto economy is maintaining a stable footing while buyers remain vigilant in accumulating positions.
Presently, it is showcased that the Wall Street Memes coin’s market activity, as paired with the valuation of the US dollar, is maintaining a stable footing while buyers remain vigilant. However, caution is advised against assuming uninterrupted upside momentum, as near-term sessions could still witness reactive pullbacks before a stronger trend re-emerges.
WSM/USD Market
Key Levels
Resistance levels: $0.0007, $0.0008, $0.0009
Support levels: $0.0005, $0.0004, $0.0003
WSM/USD – 4-hour Chart
The medium-term chart of the WSM/USD market appears well-anchored, with buyers remaining vigilant and consistently supporting most attempted price bounces.
The stochastic oscillators are steadily oscillating while maintaining a bullish baseline formation, indicating that momentum remains in favor of buyers. Meanwhile, the Bollinger Bands are slightly widening within a sideways consolidation around the $0.0006 level, suggesting that volatility is building and setting the stage for an impending directional breakout.
Does WSM/USD’s grounded outlook suggest limited upside potential if buyers fail to sustain renewed accumulation pressure?
The grounded outlook of WSM/USD does point toward limited upside potential if buyers fail to sustain renewed accumulation pressure, given that the base-crypto economy purchasers stay vigilant in their appearances.
While current stability reflects a supportive base, the absence of consistent follow-through from purchasers could expose the market to near-term weakness, with the risk of retracing toward underlying support zones before any broader recovery attempt takes shape.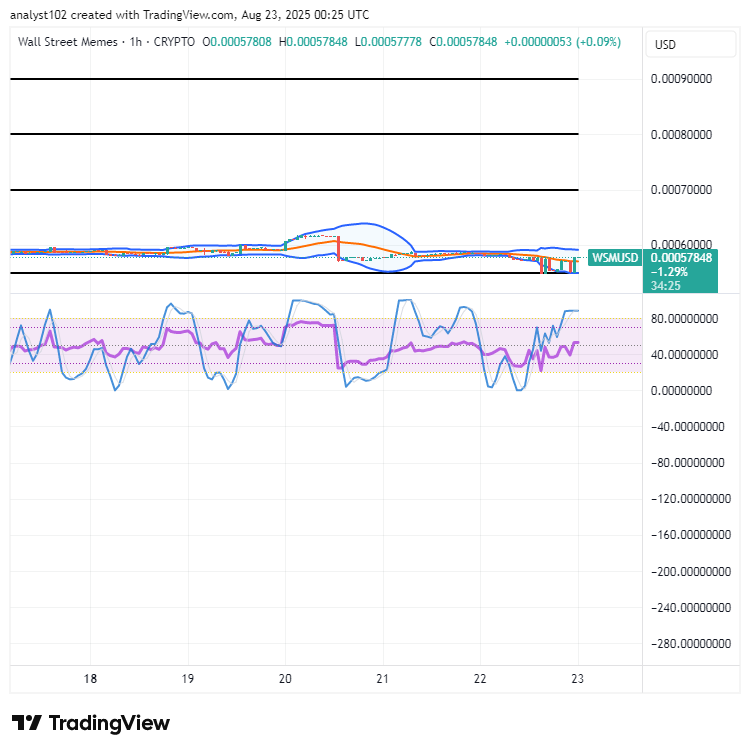
WSM/USD 1-hour chart
The 1-hour chart of the WSM/USD market has been on a grounding mode, paving the way for buyers to stay vigilant.
The Bollinger Bands are still stretching closely around the $0.0006 level, reflecting pronounced tightening consolidation phases that logically reinforce the elevated probability of sustained bullish accumulation and a potential upward breakout. As of this piece, the stochastic oscillators have shifted northbound into the overbought region, indicating that buyers are actively garnering momentum, though such positioning also raises caution against possible exhaustion if follow-through strength weakens.
Stake Today ➡️ [https://wallstmemes.com/en/dashboard](https://wallstmemes.com/en/dashboard) | Secure
Your Buy Now ➡️ [https://wallstmemes.com](https://wallstmemes.com)
🔥 Up To 43% APY Now Available 🔥
— Wall Street Memes (@wallstmemes) October 8, 2023
(at the time of posting)
Stake Now ➡️ https://t.co/X031FQo0bW Buy Now ➡️ https://t.co/6zkwWf1VRF pic.twitter.com/o9qrY1zJn8