Wall Street Memes (WSM) Trade Steps On, Bulls Stay Assertive
Estimated Reading Time: 3 minutes
Don’t invest unless you’re prepared to lose all the money you invest. This is a high-risk investment and you are unlikely to be protected if something goes wrong. Take 2 minutes to learn more

Wall Street Memes Price Prediction – August 22
It has become increasingly evident that the downward pullback attempts by WSM/USD market sellers are gradually losing intensity, given that the market steps on a baseline, making bulls stay more assertive.
The steady decline in the WSM/USD market’s bearish force reflects a shift in traders’ behavior, where selling pressure is no longer dominant, and the underlying structure is tilting toward resilience. The softening of downward momentum creates room for gradual accumulation, reinforcing confidence that bulls remain active.
WSM/USD Market
Key Levels
Resistance levels: $0.0007, $0.0008, $0.0009
Support levels: $0.0005, $0.0004, $0.0003
WSM/USD – 4-hour Chart
The medium-term chart of the WSM/USD market shows that the crypto economy is holding on a reference line, as bulls remain assertive.
The Bollinger Bands are slightly widening in a sideways consolidation pattern around the $0.0006 values, suggesting that volatility is setting the stage for directional expansion. At the same time, the stochastic oscillators have stepped firmly southbound into the oversold region, signaling that bearish exhaustion is intensifying while stronger bullish accumulation forces are gradually positioning for an imminent rebound.
Will Wall Street Memes Sustain Momentum While Stepping Firmly on a Developing Support Zone?
As it stands, Wall Street Memes coin is exhibiting growing strength, sustaining momentum on a firm support zone and reinforcing bullish prospects ahead, while the trade structure continues to keep bulls assertive.
Wall Street Memes is shaping a powerful base, sustaining momentum much like a staking protocol that rewards conviction. This resilience not only strengthens bullish confidence but also highlights the long-term value of holding, positioning WSM as a standout opportunity.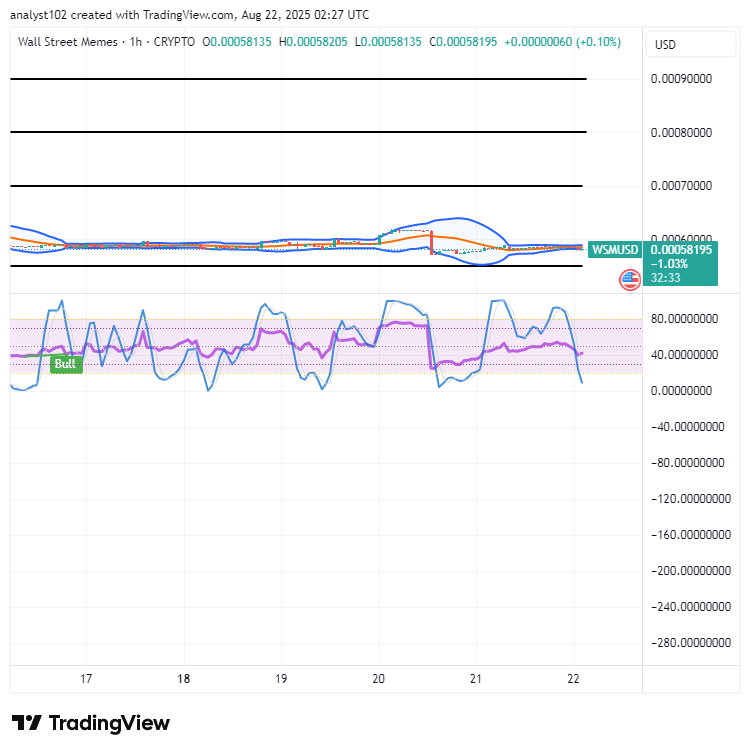
WSM/USD 1-hour chart
The 1-hour chart of the WSM/USD trade holds formation, as bulls remain assertive in their approaches.
The stochastic oscillators have decisively turned southbound in a systemic and progressive manner into the oversold region. Meanwhile, the Bollinger Bands are stretching closely around $0.0006, reflecting pronounced tightening consolidation phases and logically reinforcing elevated probabilities of sustained bullish accumulation and imminent upward breakouts.
Unlock fresh trading opportunities with flexible 1–25x leverage, now enhanced by Bybit Futures Grid Bot automation. Take advantage of market swings and maximize potential returns today.
BIGTIME: [https://i.bybit.com/20rabgrK](https://i.bybit.com/20rabgrK)
🚀 BIGTIMEUSDT & WSMUSDT Contracts now on Bybit!
— Bybit (@Bybit_Official) October 12, 2023
Dive into new trading opportunities with 1-25x leverage. Plus, they’re now on Bybit Futures Grid Bot! Start trading now.
📈 BIGTIME: https://t.co/FAQlbhnzAh
📈 WSM: https://t.co/pb2y2AfMBE#CryptoTrading #Bybit