Polkadot Trades Marginally as It Faces Rejection at $7.78
Estimated Reading Time: 2 minutes
Don’t invest unless you’re prepared to lose all the money you invest. This is a high-risk investment and you are unlikely to be protected if something goes wrong. Take 2 minutes to learn more

Free Crypto Signals Channel
Polkadot (DOT) Long-Term Analysis: Bearish
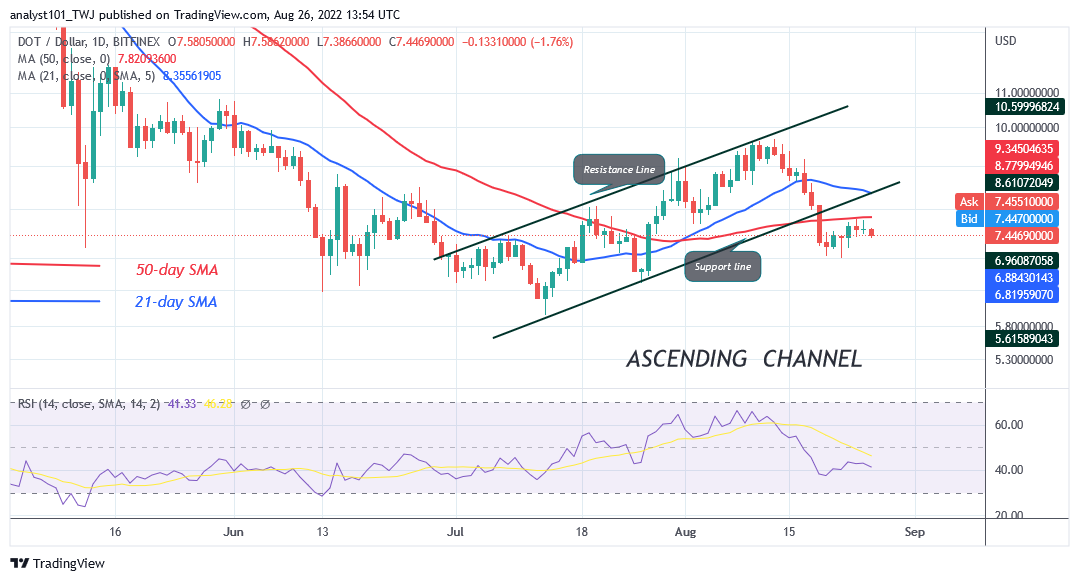
Polkadot’s (DOT) price is making an upward correction as it faces rejection at $7.78. The price movement has been insignificant because of the presence of small body candlesticks called Doji and Spinning Tops. On the upside, if the bulls break above the moving average lines, Polkadot will rise and revisit the $9.68 overhead resistance. However, the selling pressure will continue if price breaks below the current support. DOT/USD will further decline to the previous lows at $6.52 and $5.98 price levels.
Polkadot (DOT) Indicator Analysis
The altcoin is at level 42 of the Relative Strength Index for period 14. DOT price is in a downtrend zone and may further decline. The selling pressure may resume as the price bars are below the moving average lines. The altcoin price is below the 40% range of the daily stochastic. The market is in a bearish momentum.
Technical indicators:
Major Resistance Levels – $10, $12, $14
Major Support Levels – $8, $6, $4
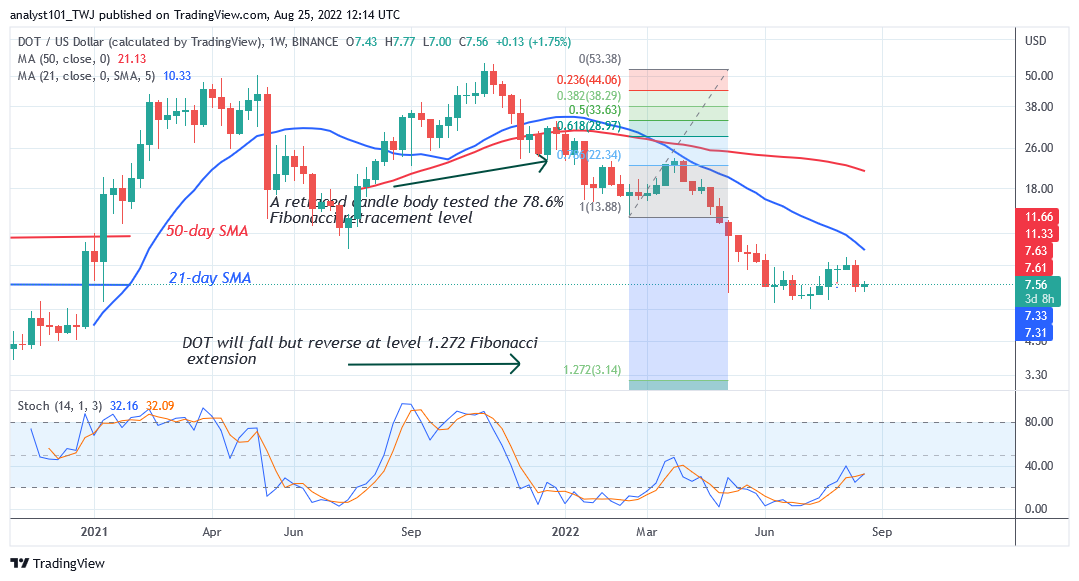
What Is the Next Direction for Polkadot (DOT)?
Polkadot is in an upward move to the previous highs as it faces rejection at $7.78. On a weekly chart, a retraced candle body tested the 78.6% Fibonacci retrenchment. The retracement suggests that DOT/USD will fall to level 1.272 Fibonacci extension or level $3.14. From the price action, the DOT price has fallen to the low of $7.00.
You can purchase crypto coins here. Buy LBLOCK
Note: Cryptosignals.org is not a 1a financial advisor. Do your research before investing your funds in any financial asset or presented product or event. We are not responsible for your investing results