Bancor (BNTUSD) Stems the Rate of Price Fall
Estimated Reading Time: 2 minutes
Don’t invest unless you’re prepared to lose all the money you invest. This is a high-risk investment and you are unlikely to be protected if something goes wrong. Take 2 minutes to learn more

Free Crypto Signals Channel
Bancor Analysis – The Market Stems the Rate of Fall at the $1.180 Level
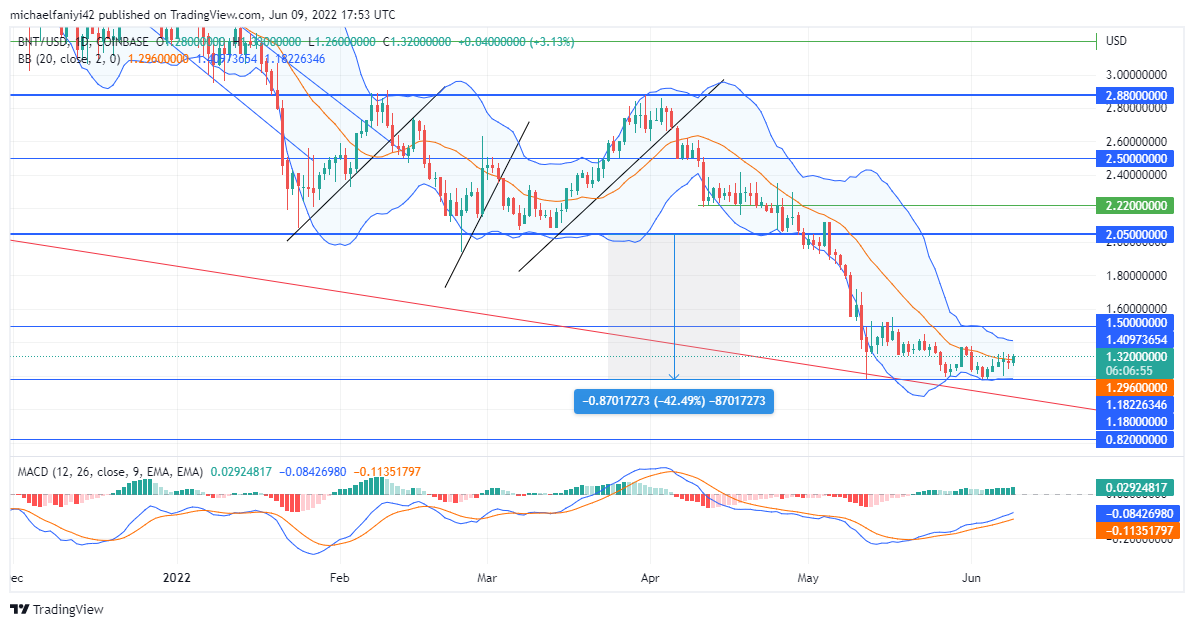
Bancor stems the rate at which the price drops at the $1.180 support level. This is after the price plummets rather sharply from the $2.050 resistance level. The sharp drop from $2.050 is that after the coin suffers rejection at $2.880, sellers determine to pull down the market, but the price was held up at around $2.220 to $2.050. When the coin finally violates these support, it then slumps and falls below $1.500.
Bancor Key Levels
Resistance Levels: $1.500, $2.050
Support Levels: $0.820, $1.180
The first five months of 2022 see the Bancor market ranging between $2.880 (as a resistance level) and $2.050. As a result, neither the bulls nor the bears totally own the market. The decision of the market influencers comes in the early days of May. Despite the efforts of the buyers to keep the price above the $2.050 support level, the market eventually breaks through to the downward side.
After the price slumps beyond the $2.050 significant level, the market drops by almost 43%, bypassing the $1.500 critical support in the process. However, the rate of price fall stems at the next support level of $1.180. Market buyers will be expected to reach this level. The lower Bollinger Band has doubled as support for the price to prevent it from further falling.

Market Expectations
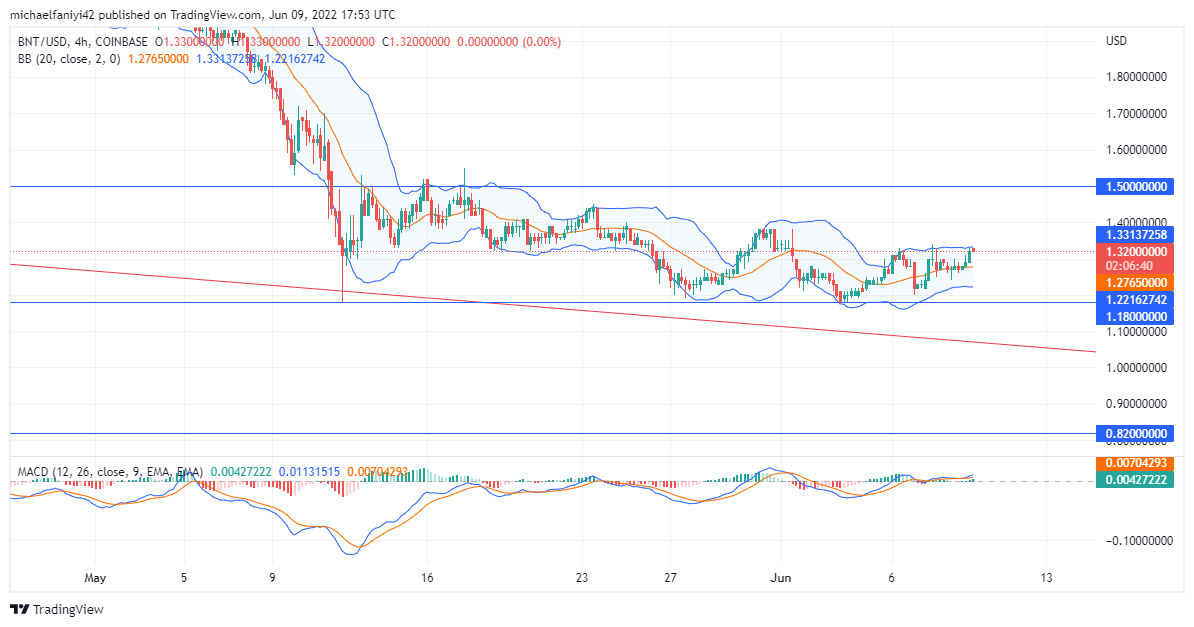
The 4-hour chart shows us that the market is moving in a sideways trend above the $1.180 support level. On the daily chart, the MACD (Moving Average Convergence Divergence) lines are attempting to rise above the zero level, indicating that the coin still has some steps to take before being considered bullish. However, the 4-hour MACD lines fluctuate around the zero level to show much action from the buyers in the short term. The price will aim to break $1.500, and a failure to do this will result in a drop to $0.820.
How To Buy Lucky Block
Note: Cryptosignals.org is not a financial advisor. Do your research before investing your funds in any financial asset or presented product or event. We are not responsible for your investing results.