Lucky Block Price Prediction: LBLOCK/USD Spikes Above $0.0021
Estimated Reading Time: 2 minutes
Don’t invest unless you’re prepared to lose all the money you invest. This is a high-risk investment and you are unlikely to be protected if something goes wrong. Take 2 minutes to learn more

Free Crypto Signals Channel
Lucky Block Price Prediction – August 30
The Lucky Block price prediction will break above the $0.0022 level to hit the $0.0023 resistance level as the bulls face the north.
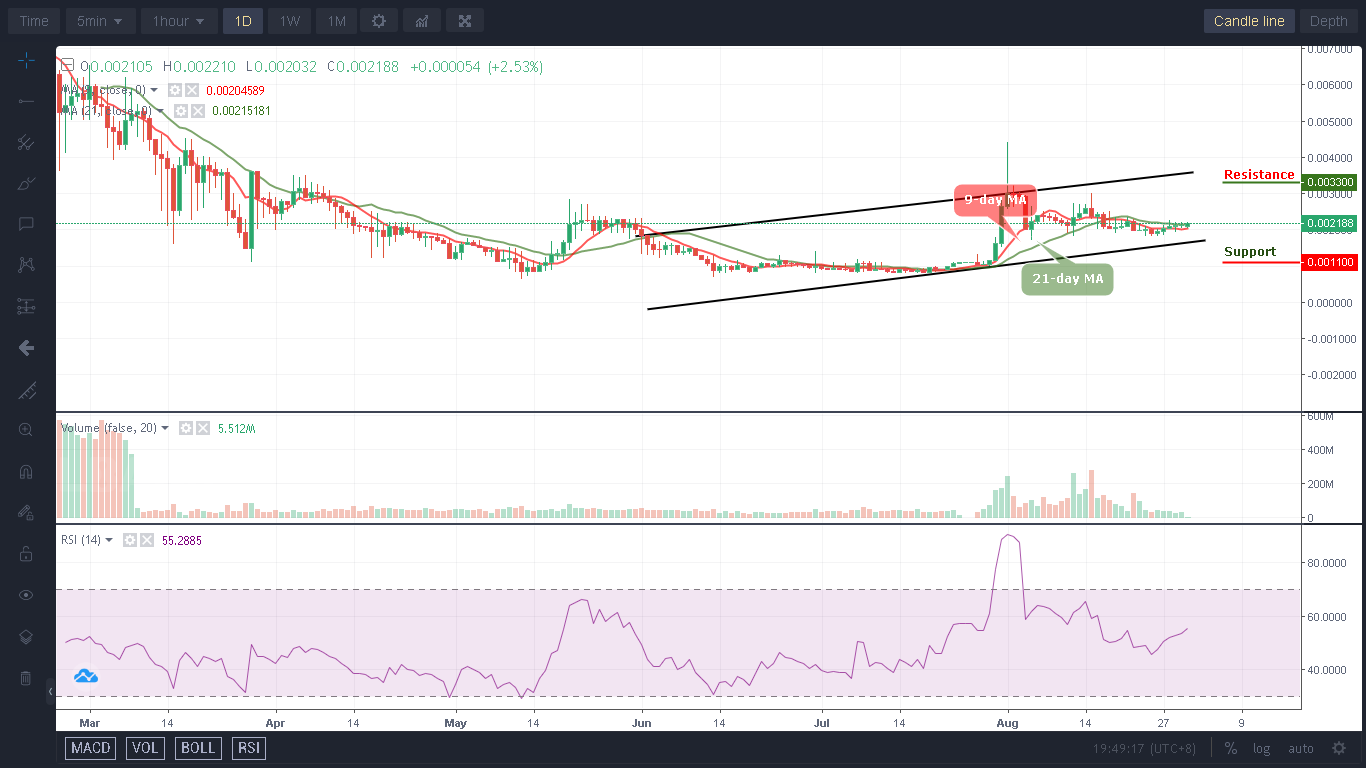
LBLOCK/USD Medium-term Trend: Bullish (1D Chart)
Key Levels:
Resistance levels: $0.0033, $0.0035, $0.0037
Support levels: $0.0011, $0.0009, $0.0007
LBLOCK/USD crosses above the 9-day and 21-day moving averages as the bullish pressure prepares for the upside. However, before breaking to the north, the market price will consolidate for a while to allow more buyers to enter the market.
Lucky Block Price Prediction: LBLOCK/USD Prepares for the North
The Lucky Block price is at the time of writing changing hands at $0.0021 where it retreats slightly, as soon as the bulls step into the market and push the coin towards the upper boundary of the channel, it will locate the potential resistance levels at $0.0033, $0.0035, and $0.0037 while the support levels may come at $0.0011, $0.0009, and $0.0007. This could be the best time for the new buyers to enter the market as the technical indicator Relative Strength Index (14) heads toward the 60-level.
LBLOCK/USD Medium-term Trend: Ranging (4H Chart)
The Lucky Block price is trading above the 9-day and 21-day moving averages which is ready to break into the positive side. Meanwhile, the technical indicator Relative Strength Index (14) confirms that the coin will head to the upside as the signal line crosses above the 60-level. Therefore, any bullish movement above the channel’s upper boundary will hit the resistance level at $0.0024 and above.
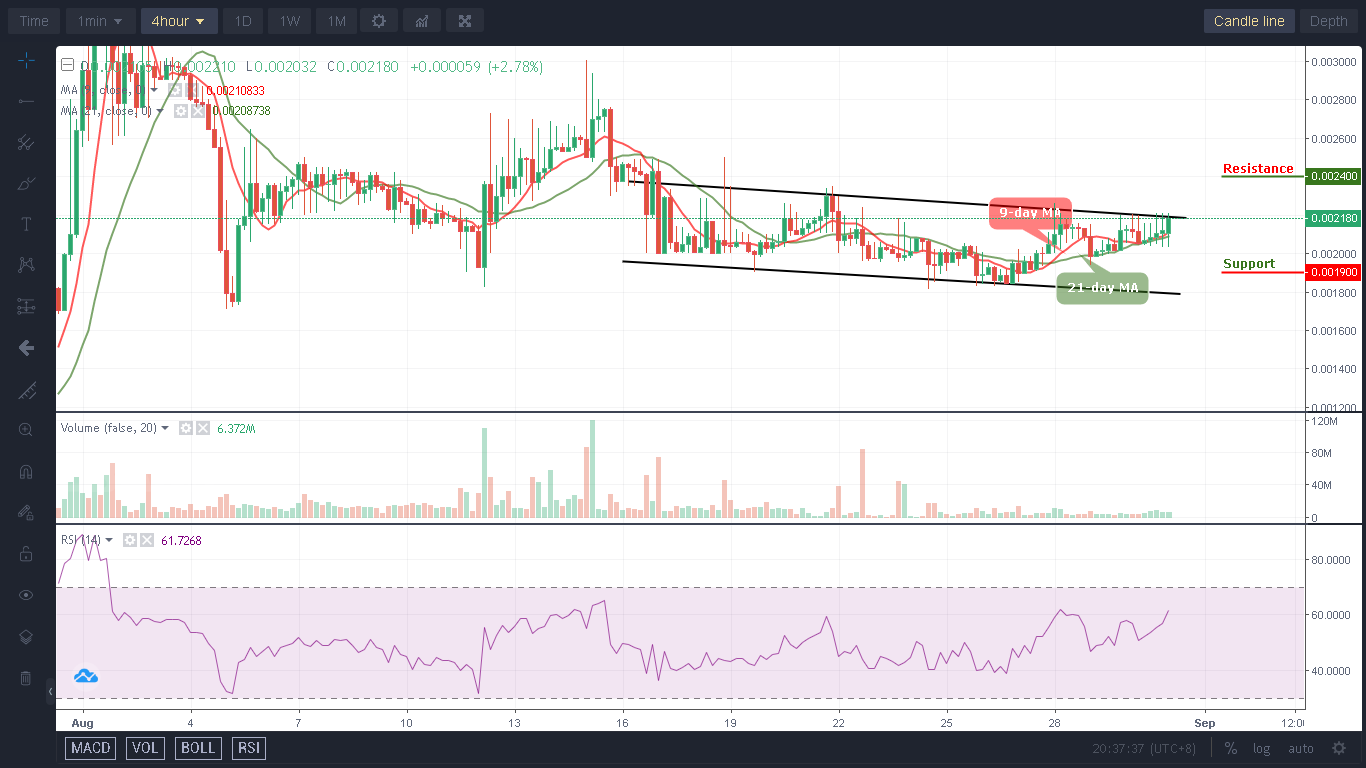
However, the coin would experience more bullish signals but if the price drop below the current market value, this could be an opportunity for new buyers to come into the market as the market price could touch the support at $0.0019 and below.
You can purchase Lucky Block here. Buy LBLOCK