Wall Street Memes (WSM) Price Surges, Forces Powering Up
Estimated Reading Time: 3 minutes
Don’t invest unless you’re prepared to lose all the money you invest. This is a high-risk investment and you are unlikely to be protected if something goes wrong. Take 2 minutes to learn more
Wall Street Memes Price Prediction – October 6
The WSM/USD market exhibits strengthening bullish traction as surging price action meets rising momentum. Increasing participation and energized buying forces position the token against the U.S. dollar with heightened prospects for sustained upward continuation.
The WSM/USD trade is charting sustained upside momentum as rising price action synchronizes with strengthening volume dynamics. Bullish forces are steadily powering up, projecting a long-term outlook where persistent upward pressures promise extended gains, keeping Wall Street Memes firmly positioned against the U.S. dollar.
WSM/USD Market
Key Levels
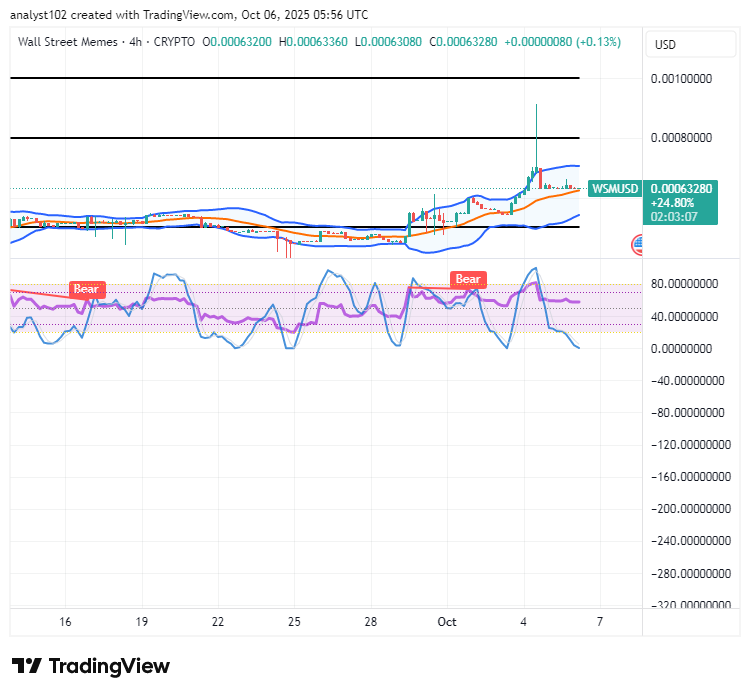
Resistance levels: $0.0008, $0.0009, $0.001
Support levels: $0.0005, $0.0004, $0.0003
WSM/USD – 4-hour Chart
It is presently on the WSM/USD medium-term chart that the crypto-economic price surges as market forces power up.
The Stochastic Oscillators have traversed southbound into the oversold territory, affirming that strategic buyers are steadily positioning themselves, carefully preparing stronger stances for renewed accumulation phases. Meanwhile, the Bollinger Bands remain systematically tilted northward, firmly reinforcing a resilient upside bias outlook.
How Sustainable Are the Crypto-Economic Price Surges as Underlying Market Forces Continue Powering Up?
The WSM/USD market surges appear sustainable as underlying market forces strengthen steadily.
With heightened liquidity inflows, resilient buyer participation, and technical indicators aligning northward, momentum reinforces bullish confidence. Long-term prospects suggest continued upward pressures, establishing favorable grounds for extended market expansion against potential corrective interruptions.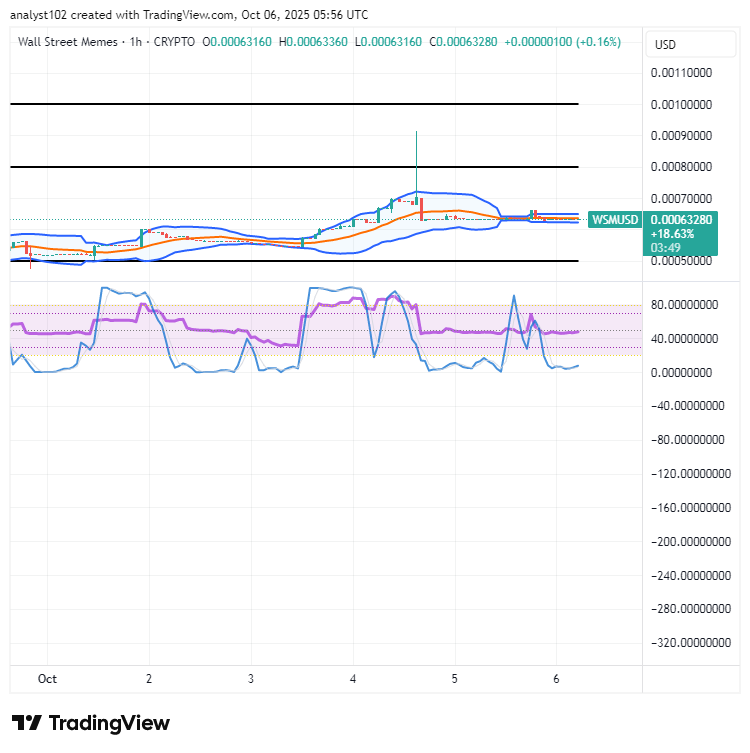
WSM/USD 1-hour chart
The 1-hour chart of WSM/USD showcases that the crypto-trade price surges as market forces power up.
The Bollinger Bands indicator channels have distinctly tilted northward, progressively widening further toward the crucial threshold of $0.0007. Simultaneously, the Stochastic Oscillators are slightly southbound, initiating renewed and determined corrective efforts to pivot closely back toward the key value of 80 points upward.
Earn Up To 43% APY Now Available Today
Stake Instantly ➡️ [https://wallstmemes.com/en/dashboard](https://wallstmemes.com/en/dashboard)
Buy Easily ➡️ [https://wallstmemes.com](https://wallstmemes.com)
🔥 Up To 43% APY Now Available 🔥
— Wall Street Memes (@wallstmemes) October 8, 2023
(at the time of posting)
Stake Now ➡️ https://t.co/X031FQo0bW Buy Now ➡️ https://t.co/6zkwWf1VRF pic.twitter.com/o9qrY1zJn8
Buy and stake WSM now! https://wallstmemes.com/