Wall Street Memes (WSM) Trade Bounces, Steadying for Spirals
Estimated Reading Time: 3 minutes
Don’t invest unless you’re prepared to lose all the money you invest. This is a high-risk investment and you are unlikely to be protected if something goes wrong. Take 2 minutes to learn more

Wall Street Memes Price Prediction – October 5
The Wall Street Memes (WSM/USD) pair has rebounded firmly against the US dollar, balancing recent price pressures and steadying for possible spirals as market participants anticipate the next decisive directional wave.
As the WSM market has rebounded against the US dollar, it shows resilience amid recent fluctuations. The market steadies for potential spirals while buyers continue to anchor positions at favorable levels. Right now, people believe that keeping investments for the long term is the best strategy, as the overall trend suggests steady growth rather than quick sell-offs.
WSM/USD Market
Key Levels
Resistance levels: $0.0008, $0.0009, $0.001
Support levels: $0.0005, $0.0004, $0.0003
WSM/USD – 4-hour Chart
It has been demonstrated on the WSM/USD medium-term chart that the crypto trade bounces, steadying for spirals.
The Bollinger Bands remain systematically tilted northward, reinforcing an upside bias. Meanwhile, the Stochastic Oscillators have shifted southbound into the oversold territory, affirming that buyers are steadily positioning themselves and preparing stances for renewed accumulation.
Will WSM/USD Sustain Its Trade Bounces While Steadying for Spirals Against Broader Market Pressures?
WSM/USD market is likely to maintain its bounce momentum while steadying for spirals, as buying sentiment gradually underpins the market.
Sustained positioning suggests that long-term accumulation could outperform short-term volatility, reinforcing confidence in upside prospects. This outlook highlights that investors who strategically build positions over time are better placed to capture gradual appreciation, mitigate sudden fluctuations, and align with broader market growth cycles.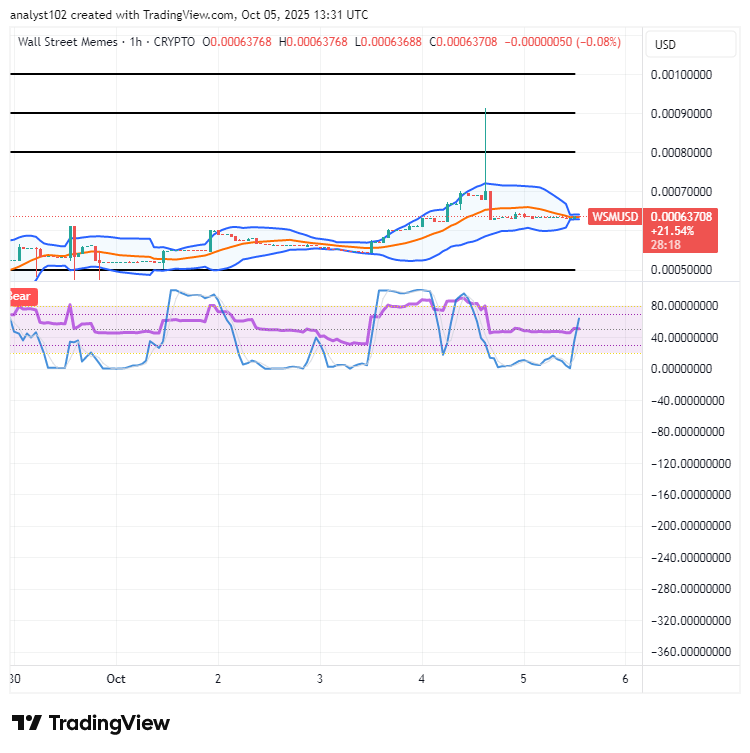
WSM/USD 1-hour chart
The 1-hour chart of WSM/USD showcases that the crypto trade bounces, steadying for spirals.
The Bollinger Bands indicator channels have tilted northward, progressively widening until nearing the crucial threshold of $0.0007. The Stochastic Oscillators are slightly positioned southbound, making renewed efforts to point back closely to the key value of 80 points upward.
$WSM / $USDT is now officially tradeable on #Bybit Perpetuals futures market.
Trade instantly here: [https://i.bybit.com/1Wab4K3z]
$WSM community, we saw your Tweets! 👏$WSM / $USDT is now tradeable on #Bybit Perpetuals.
— Bybit (@Bybit_Official) October 13, 2023
Trade here: https://t.co/le4XyVyXaZ
Also want your project listed? Share your suggestions here:https://t.co/W7EWJVVNV5 https://t.co/XgXoL7g0rF
Buy and stake WSM now! https://wallstmemes.com/