Quant (QNT) Exhibits Steady Market Trends with Mild Bearish Indicators
Estimated Reading Time: 2 minutes
Don’t invest unless you’re prepared to lose all the money you invest. This is a high-risk investment and you are unlikely to be protected if something goes wrong. Take 2 minutes to learn more
Quant (QNT) Price Analysis – June 1
Quant (QNT) is currently valued at $90.35, with a trading volume of $10,284,595 over the past 24 hours, resulting from the exchange of 113,832 QNT coins. The price has experienced a slight decline of 0.55% in the last 24 hours.
In the larger context, QNT has witnessed a 15.27% decline from its peak price over the past 30 days and a 5.52% decrease over the last 7 days. However, it has made a marginal recovery of 1.15% from its minimum price during these periods.
Daily Chart Analysis
Technical analysis on the daily chart reveals that QNT is trading below the middle band, indicating potential bearish momentum. The upper band at $100 serves as a resistance level, while the lower band at $88 provides immediate support. 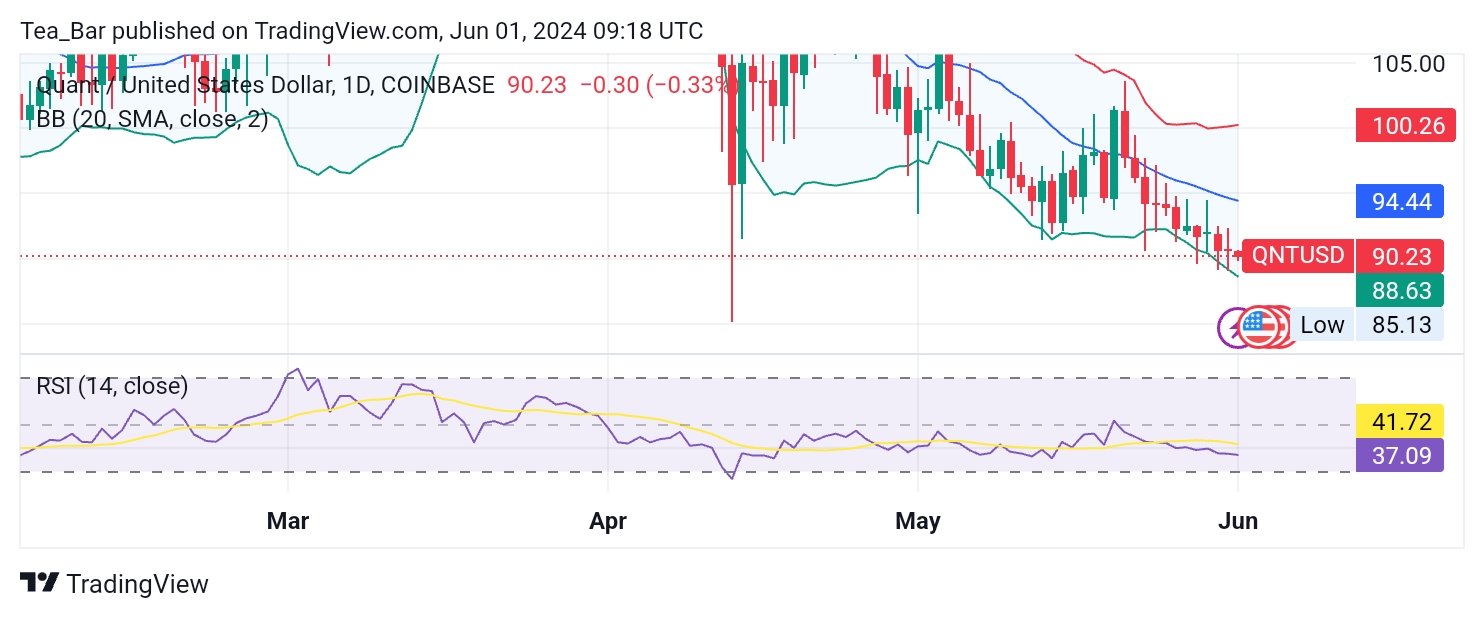
With an RSI of 37, QNT is approaching oversold territory, suggesting that the selling pressure may be easing, and a potential rebound could be on the horizon if the RSI moves below 30.
4-Hour Chart Analysis
On the 4-hour chart, QNT is trading close to the middle band, indicating a relatively stable price range with short-term support at $89 and resistance at $92.
An RSI of 43 on the 4-hour chart indicates a neutral to slightly bearish sentiment, suggesting balanced market conditions with a slight downward bias.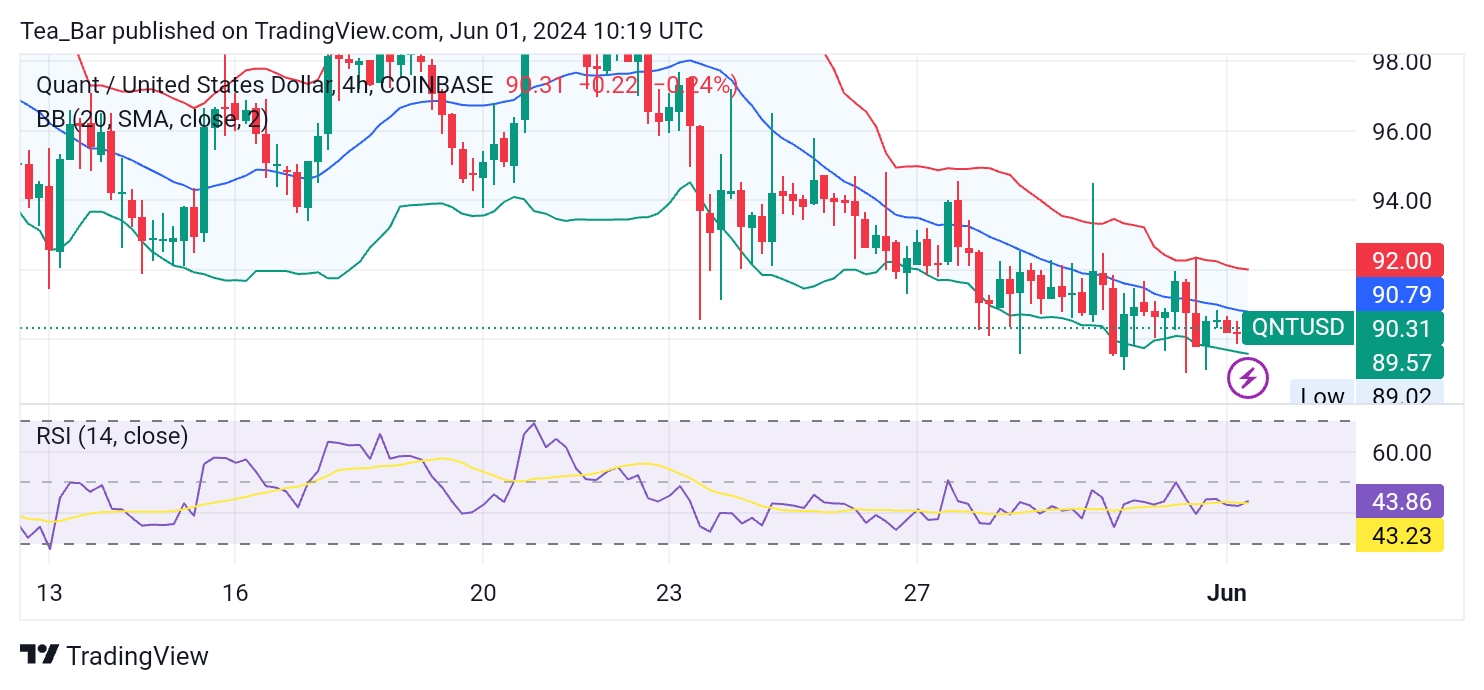
Conclusion
Quant (QNT) exhibits a neutral to bearish outlook based on current technical indicators. The price is hovering near key support levels, with limited upside potential in the short term.
A break below $88 on the daily chart could signal further declines, while a move above $94 may indicate a bullish reversal. On the 4-hour chart, close attention should be paid to the $89 support and $92 resistance levels for immediate trading signals.
Place winning Quant trades with us. Get QNT here.