Quant (QNT) May be Due for a Bounce: Technical Analysis
Estimated Reading Time: 3 minutes
Don’t invest unless you’re prepared to lose all the money you invest. This is a high-risk investment and you are unlikely to be protected if something goes wrong. Take 2 minutes to learn more

Quant (QNT) Price Prediction – May 23
As of the time of writing, Quant (QNT) stands at $91.71. In the last 24 hours, a total of 191,226 QNT coins were exchanged, resulting in a trading volume of $17,730,161.
This marks a 4.43% decrease in price over the past 24 hours.Quant (QNT) has a circulating supply of 12 million coins and holds the #73 rank based on its market capitalization, which is currently valued at $1 billion.
This reflects the significant interest and value placed on QNT within the cryptocurrency market. Today, Quant (QNT) opened at $96.34, but it has since decreased by 3.76% from its opening price. Despite an attempt to rally to $97.49, the coin faced resistance and was unable to sustain the upward momentum.
Over the past 30 days, the price has dropped by 20.29%, and over the past 7 days, it has decreased by 10.02%. However, from the minimum recorded price in the same timeframes, it is up by only 0.82% and down by 0.84%, respectively.
1-Day Chart Analysis
On the 1-day chart, Quant (QNT) is trading near the lower Bollinger Band at $91.84, with the middle band at $96.88 and the upper band at $101.92. This positioning suggests that the price is near the lower end of its recent trading range, potentially indicating overselling.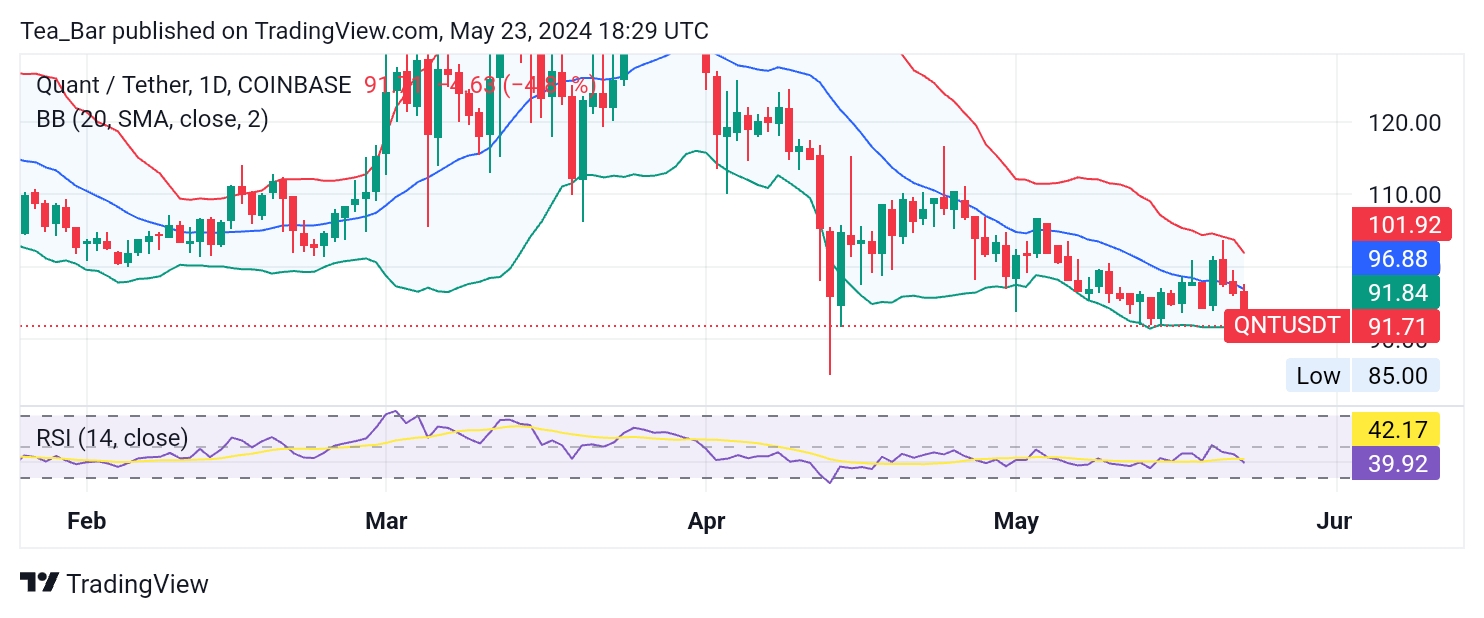
The Relative Strength Index (RSI) on the 1-day chart is at 39. An RSI below 50 generally indicates a bearish trend, and an RSI approaching 30 suggests that the asset may be oversold.
Therefore, the current RSI suggests that QNT might be nearing oversold conditions, which could precede a potential rebound if buying interest increases.
4-Hour Chart Analysis
On the 4-hour chart, the Bollinger Bands are slightly wider, with the lower band at $92.92, the middle band at $97.69, and the upper band at $102.47. Similar to the 1-day chart, QNT is trading near the lower Bollinger Band, indicating potential overselling in the shorter term.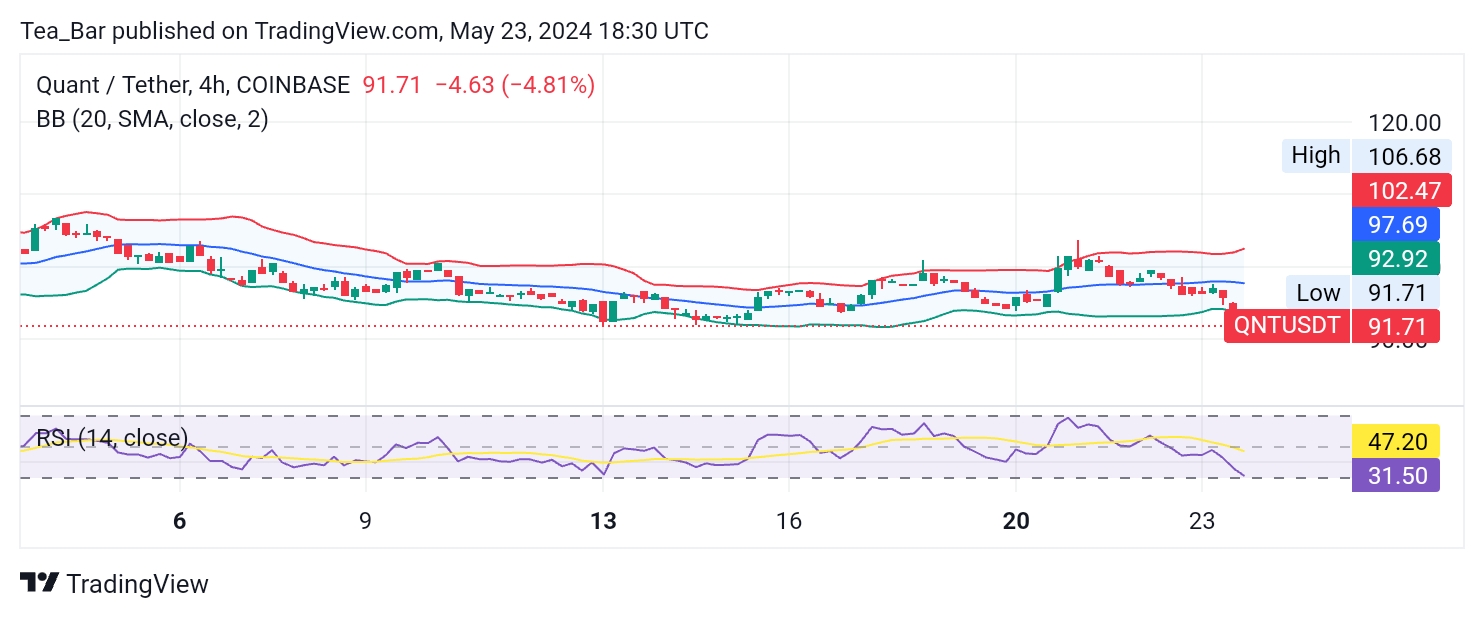
The RSI on the 4-hour chart is even lower at 31. This level is close to the oversold threshold of 30, suggesting that QNT is heavily oversold in the short-term timeframe.
Such an RSI reading could indicate an imminent price correction or a potential buying opportunity for traders looking to capitalize on the lower prices.
Conclusion
Despite recent downward trends, the technical indicators from both the 1-day and 4-hour charts suggest that Quant (QNT) may be oversold, potentially indicating a buying opportunity for investors.
The oversold conditions and strong support levels imply that QNT might be due for a rebound. Quant’s position as a key player in blockchain interoperability and its solid market capitalization underscores its potential for recovery and long-term growth.
Place winning Quant trades with us. Get QNT here.