Exploring Quant (QNT): Analyzing Price Trends and Market Sentiment
Estimated Reading Time: 3 minutes
Don’t invest unless you’re prepared to lose all the money you invest. This is a high-risk investment and you are unlikely to be protected if something goes wrong. Take 2 minutes to learn more

Quant (QNT) Price Prediction – May 16
Quant (QNT) continues to capture the attention of cryptocurrency enthusiasts, prompting speculation on whether it will surpass a significant psychological barrier.
Today, QNT kicked off trading at $96.68, seeing a minor dip of -0.48% from its initial value. Despite momentarily reaching $96.94, QNT struggled to maintain upward momentum due to resistance.
Over the past 30 and 7 days, QNT has experienced declines of -17.28% and -4.17% respectively from peak prices, yet it has resiliently surged by 4.62% from its recent low. Presently, QNT is priced at $96.22, with a trading volume of $15,320,767 in the last 24 hours, marking a 3.94% increase.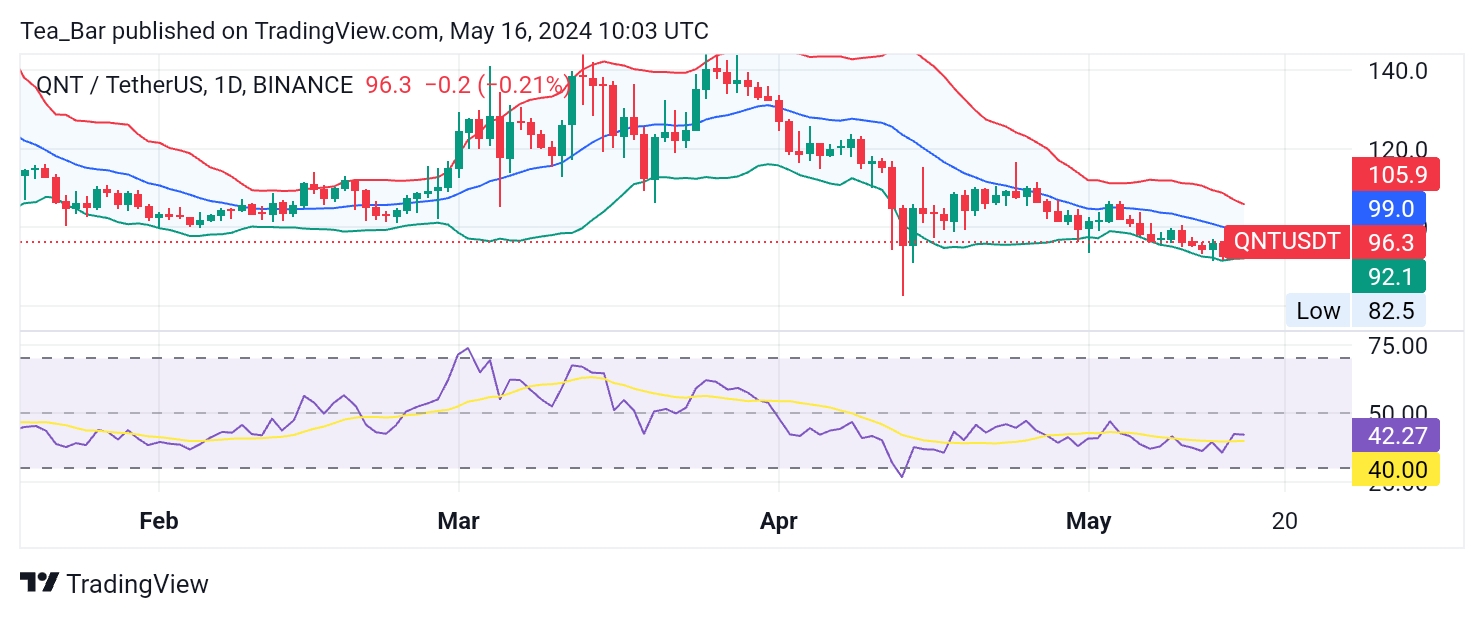
QNT/USD Long-term Trend (Daily Chart)
Key Levels:
Resistance: $100, $105, $110
Support: $92, $88, $84
Examining the 1-day chart, Quant (QNT) currently resides below the Bollinger Bands’ midpoint, hinting at a potential downtrend. With a Relative Strength Index (RSI) of 42, the market sentiment appears neutral, suggesting a period of consolidation or uncertainty.
Notably, the upper Bollinger Band at $105.9 presents a resistance barrier, while the lower band at $92.1 acts as support.
QNT/USD Medium-Term Trend: Bullish (4H Chart)
Reviewing the 4-hour chart, QNT stands above the middle line of the Bollinger Bands, signaling short-term bullish sentiment. Supported by an RSI of 56, this indicates a favorable momentum for buyers, signifying their dominance. 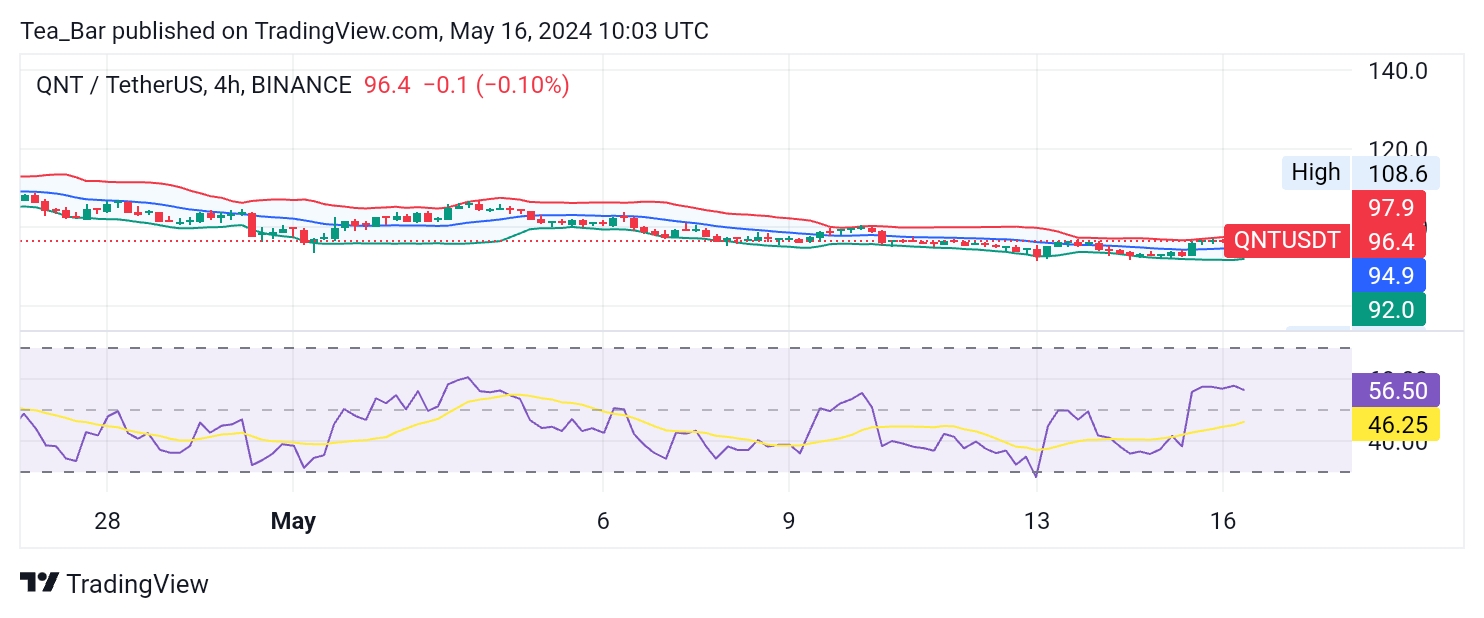
Resistance is evident at $97.9, indicating a potential increase in selling pressure, while support lies at $92.0, signaling strengthening buying interest. Short-term traders may consider long positions as long as QNT remains above the middle line and the RSI continues to support bullish momentum.
Conclusion
Despite encountering short-term resistance, Quant (QNT) exhibits resilience and a promising upward trajectory. While the 1-day chart reflects neutrality, the 4-hour chart presents bullish momentum, backed by an RSI of 56.
With clear support levels at $92.1 and $92.0, and resistance levels at $105.9 and $97.9, traders possess crucial reference points for strategic decisions. Considering the bullish sentiment in the shorter term and the overall growth potential in the cryptocurrency realm, investors might uncover opportunities to leverage QNT’s upward prospects.
Place winning Quant trades with us. Get QNT here.