Berachain price Eyes Recovery Amid Strategic Infrastructure Expansion
Estimated Reading Time: 4 minutes
Don’t invest unless you’re prepared to lose all the money you invest. This is a high-risk investment and you are unlikely to be protected if something goes wrong. Take 2 minutes to learn more

Berachain against Tether in recent times has seen a modest 1.05% increase, nearly keeping pace with the broader market. As it stands, this recovery seems to be following a sharp 35% decline, with the Berachain price leaving the oversold territory with a weekly RSI of 40.1. From the fundamental side, it appears that the catalyst behind these changes remains investors’ optimism regarding the Bera Builds Businesses strategic pivot, which focuses on a sustainable revenue-generating model.
Right now, the immediate outlook hinges on a potential short squeeze. This technical setup, combined with the fundamental shift in its business model, suggests BERA is primed for a volatile rebound even as $96.2 million in open interest is clustered near the $1.05 resistance level.
Currently, Berachain trades at $0.653 with over 1.19 million traded volumes on the daily chart.
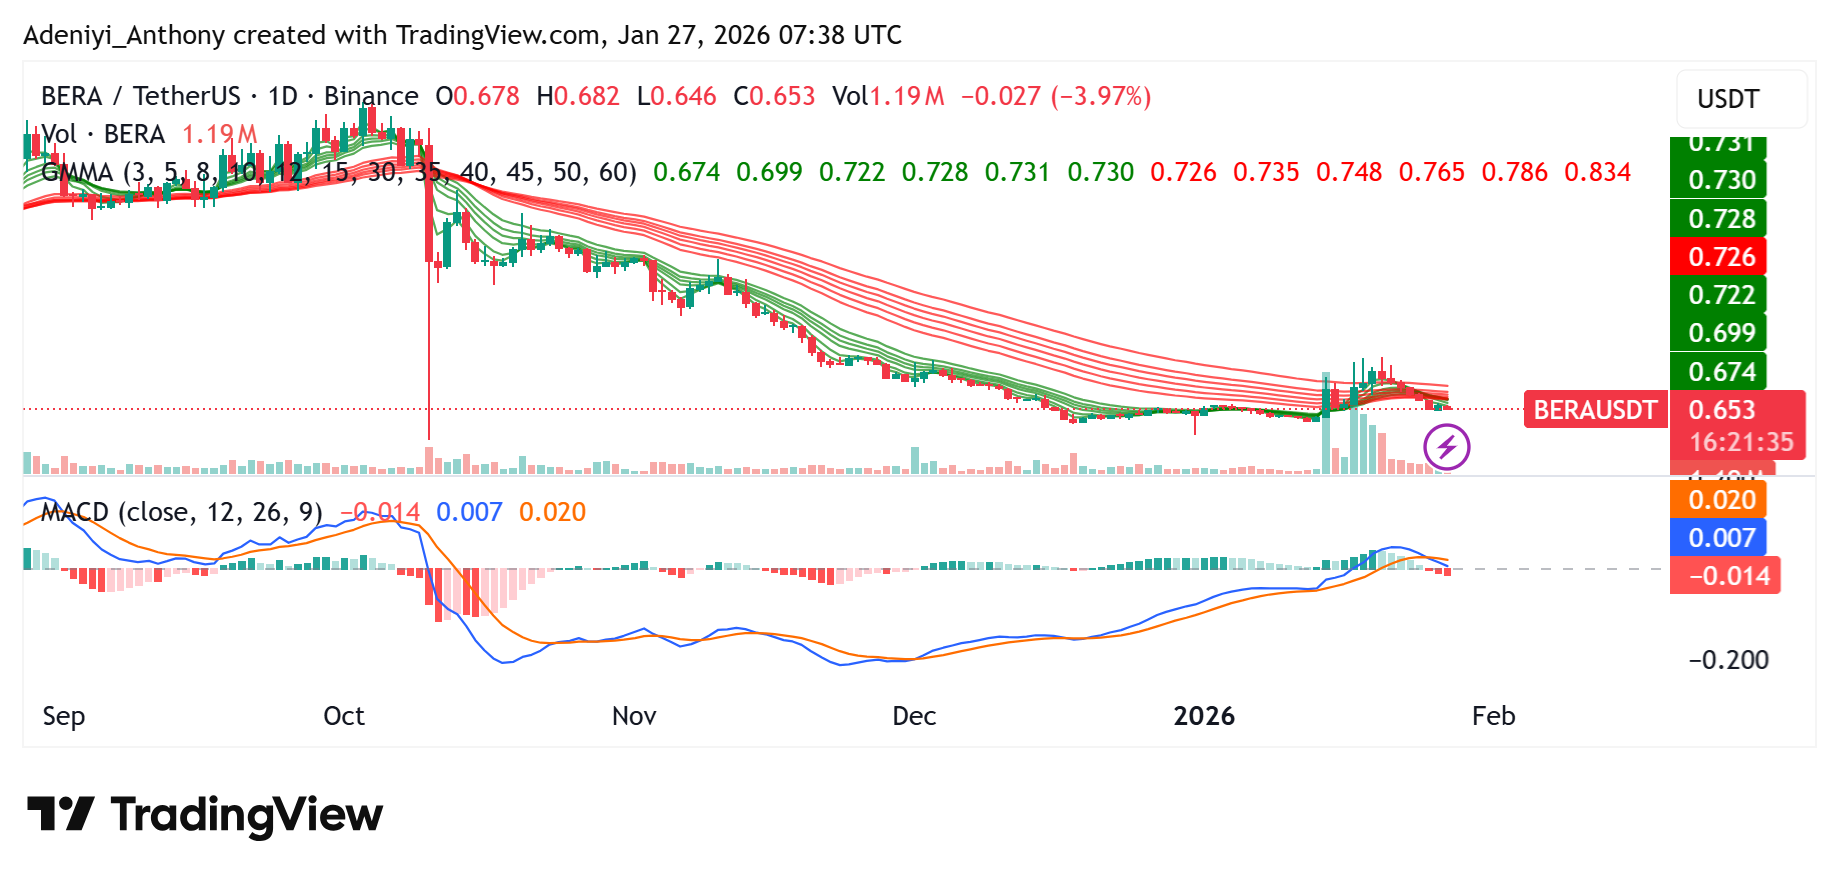
Technical Indicators
Major Resistance Levels: $0.740, $0.850, and $1.020
Major Support Levels: $0.600, $0.540, and $0.500
Technical Analysis
Technical indicators on the daily timeframe suggest that the Berachain price is currently in a consolidation phase. Its operation is obviously below the cluster of the Guppy Multiple Moving Averages (GMMA). Furthermore, the current position seems not to be dictating as the token gears towards the next resistance level with decreasing pressure.
However, a reducing bullish momentum seems to be spotted on the MACD histogram, suggesting that the downward momentum is just starting. To this end, as long as the price maintains its position above the $0.60 support, the probability of a test toward the $0.85 resistance remains high.
Meanwhile, @0xBlesd has suggested that investors may have to look beyond superficial noise and the false narrative. The analyst opined that Berachain ($BERA) is currently undervalued, and once the chart becomes clearer, the Berachain price action will become obvious.
Ultimately, the post predicts that price action will drive a total rebranding of Berachain within the crypto community rather than its current reputation, suggesting the platform is positioned to become the primary destination for significant financial gains and market leadership.
When you look beyond the noise, when you filter out the false narratives, when you see what is hidden from plain view…
it all becomes clear for $BERA
Price alone will lead the charge to rebrand the word “Berachain” in the language of CT.
Berachain will just be the place you… pic.twitter.com/oNnNZ96cs2
— Blesd (@0xBlesd) January 26, 2026
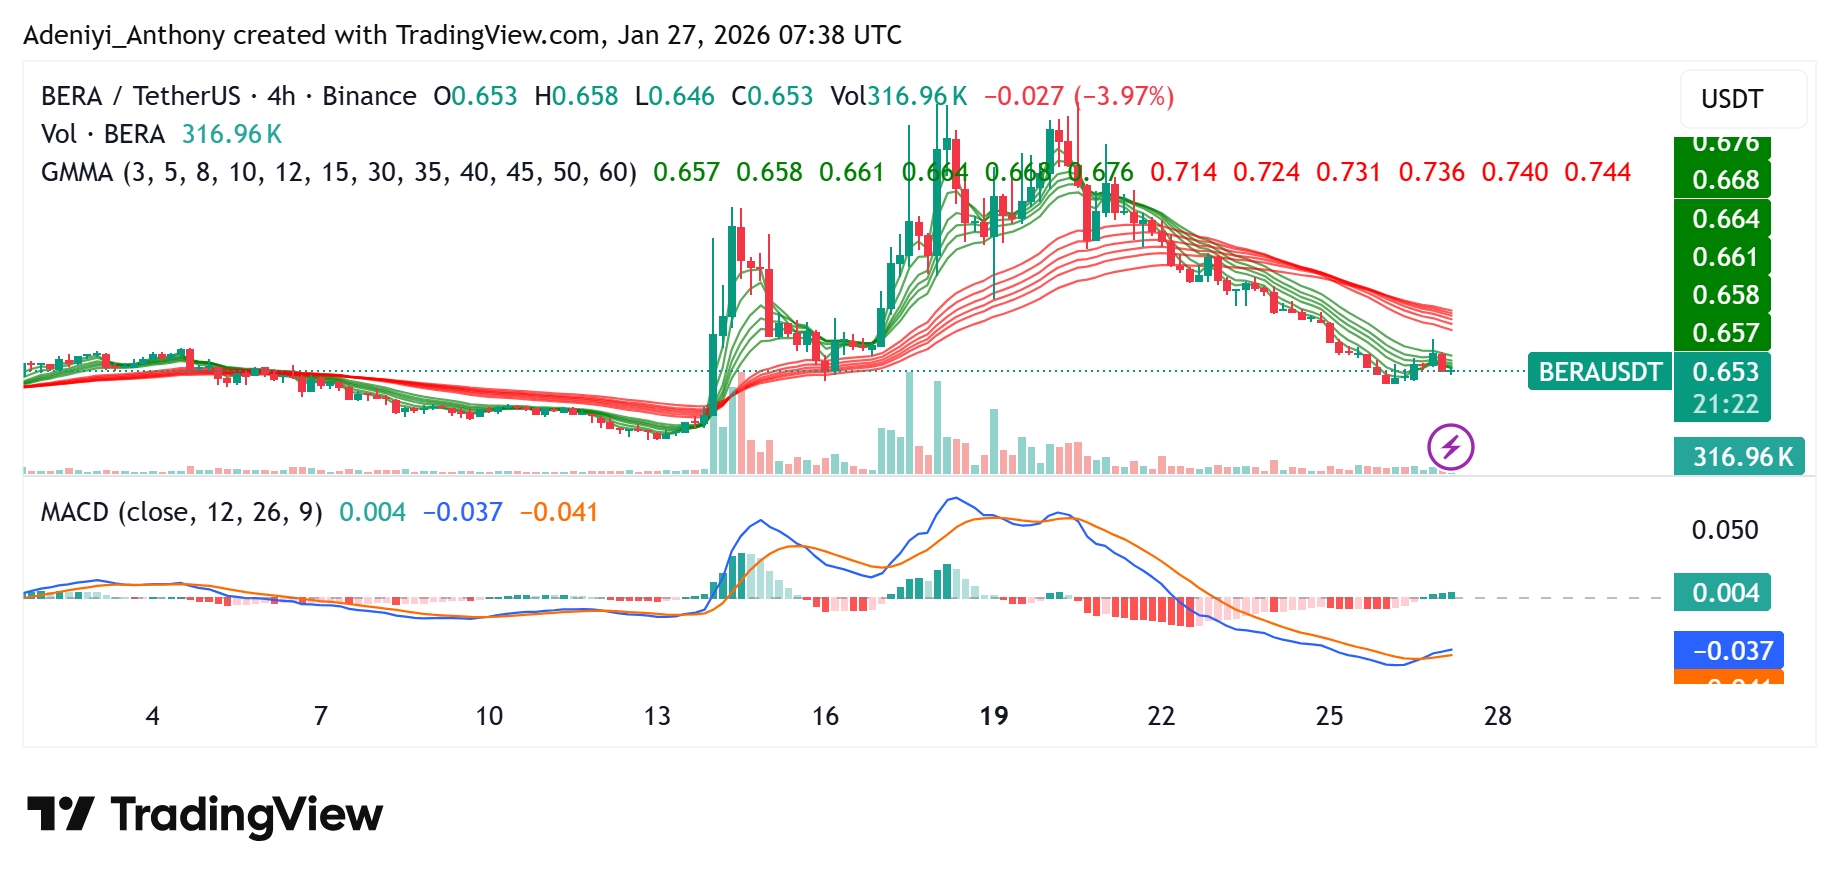
BERA/USDT Analysis: Berachain Price Pattern Hints at Local Breakout
On the 4-hour chart, it appears that BERA/USDT is currently breaking out of a falling wedge pattern. Additionally, the Berachain price was seen again testing the short-period Exponential Moving Average (EMA). A sustained close above these EMAs on the 4-hour candle could provide the necessary fuel to push the pair toward the immediate local target.
Meanwhile, the 4-hour MACD suggests that a bullish divergence is forming, and an increase in momentum would confirm a shift in momentum toward the $0.740 resistance level.
You can purchase crypto coins here. Buy Crypto


