Berachain Market Analysis: Bullish Consolidation at Multi-Month Highs
Estimated Reading Time: 4 minutes
Don’t invest unless you’re prepared to lose all the money you invest. This is a high-risk investment and you are unlikely to be protected if something goes wrong. Take 2 minutes to learn more

Berachain in recent times has surged 10.69% daily and nearly 80% weekly. This shows a significant performance compared to the broader crypto market, as it appears the Berachain market rally is driven by strong technical momentum and the “Bera Builds Businesses” shift toward sustainable revenue models.
In addition to this development, it has been noted that increasing corporate treasury interest and the launch of new ecosystems, such as Rhea Finance, are fueling demand. Meanwhile, despite high RSI levels, investor confidence remains high.
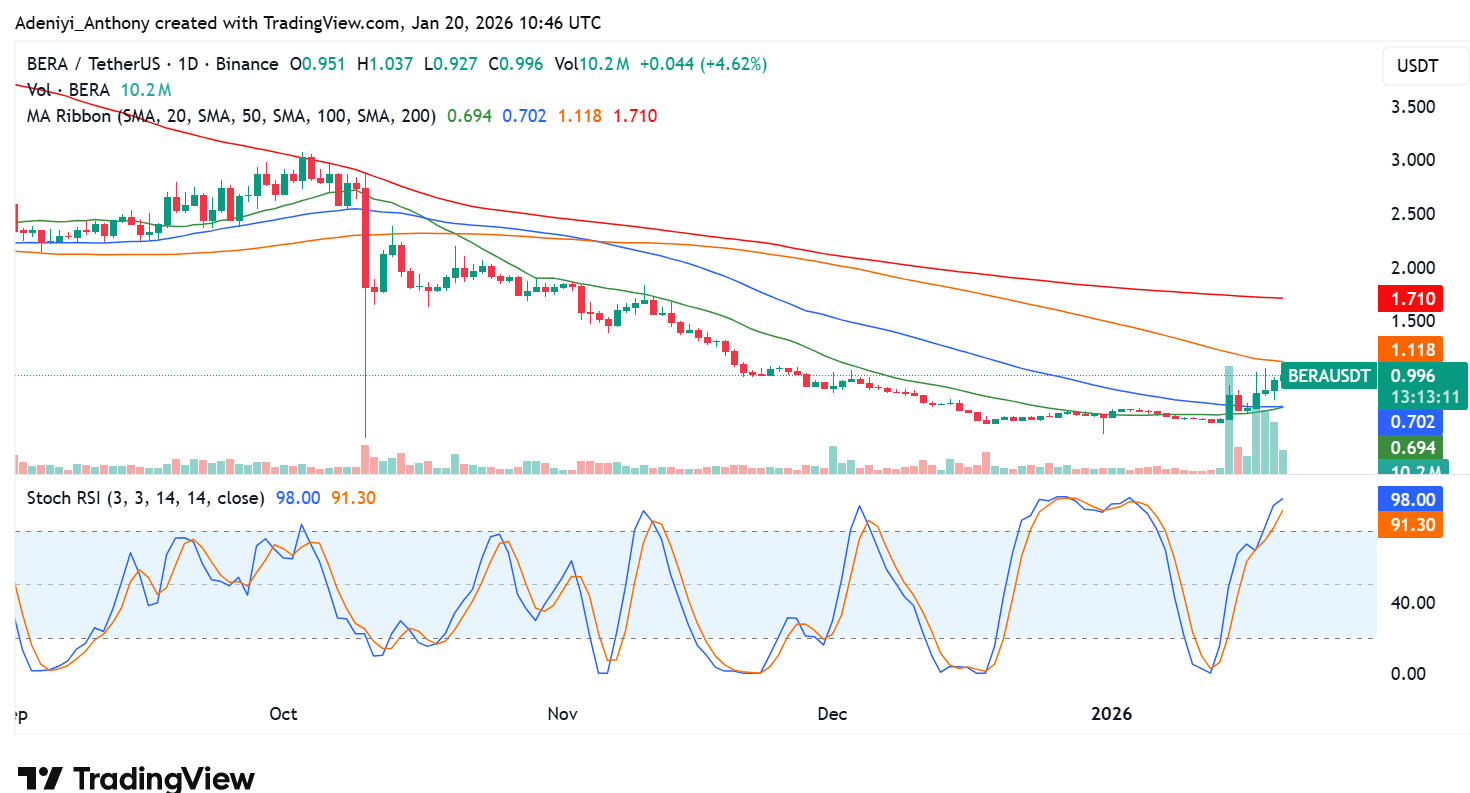
Currently, Berachain trades at $0.996 with more than 10.2 million traded volumes on the daily timeframe.
Technical Indicators
Major Resistance Levels: $1.020, $1.500, and $1.710
Major Support Levels: $0.876, $0.786, and $0.700
Will the Berachain Market Price Establish a Base Above $1.00?
As it stands, @krasnovcrypto has observed that Berachain has established multiple liquidity levels, both at a higher timeframe and locally. This is pointing to “pockets” of interest that the price is likely to gravitate toward. The analyst suggests that while the price is poised to “hunt” this liquidity, a high-quality trade entry is not yet available, urging traders to await a period of solid consolidation to confirm the move.
The coin has formed higher-level and one local level, which further suggests that there’s good liquidity there
Therefore, the price is likely to go after this liquidity, but to enter a trade, there needs to be quality consolidation pic.twitter.com/MEVIktZ8Bb
— Krasnov (@krasnovcrypto) January 20, 2026
Technical Analysis
Technically, Berachain has been aligned bullishly against Tether on the daily chart. The Berachain market price appears to be trading above the cluster of the simple moving averages (SMA), signaling an uptrend. Although the Stochastic RSI suggests an overbought condition and a potential exhaustion ahead, the overall structure remains bullish as the price sits above $0.800.
To this end, if momentum holds with improved volume as seen on the chart above, a potential move above the $1.200 mark may be recorded before the February supply event.
Berachain Downtrend Resistance & Potential Breakout Alert
In a recent analysis, Berachain appears to be testing key resistance between $1.06 and $1.60. This suggests the token is making a move for a breakout towards $3.15, ending the downtrend. However, failure to consolidate above recent lows risks a “death spiral.” To this end, caution must be applied, as previous retests of these levels resulted in significant price rejections and lower lows.
BERA/USDT Analysis: Finding Balance After Sharp Rally
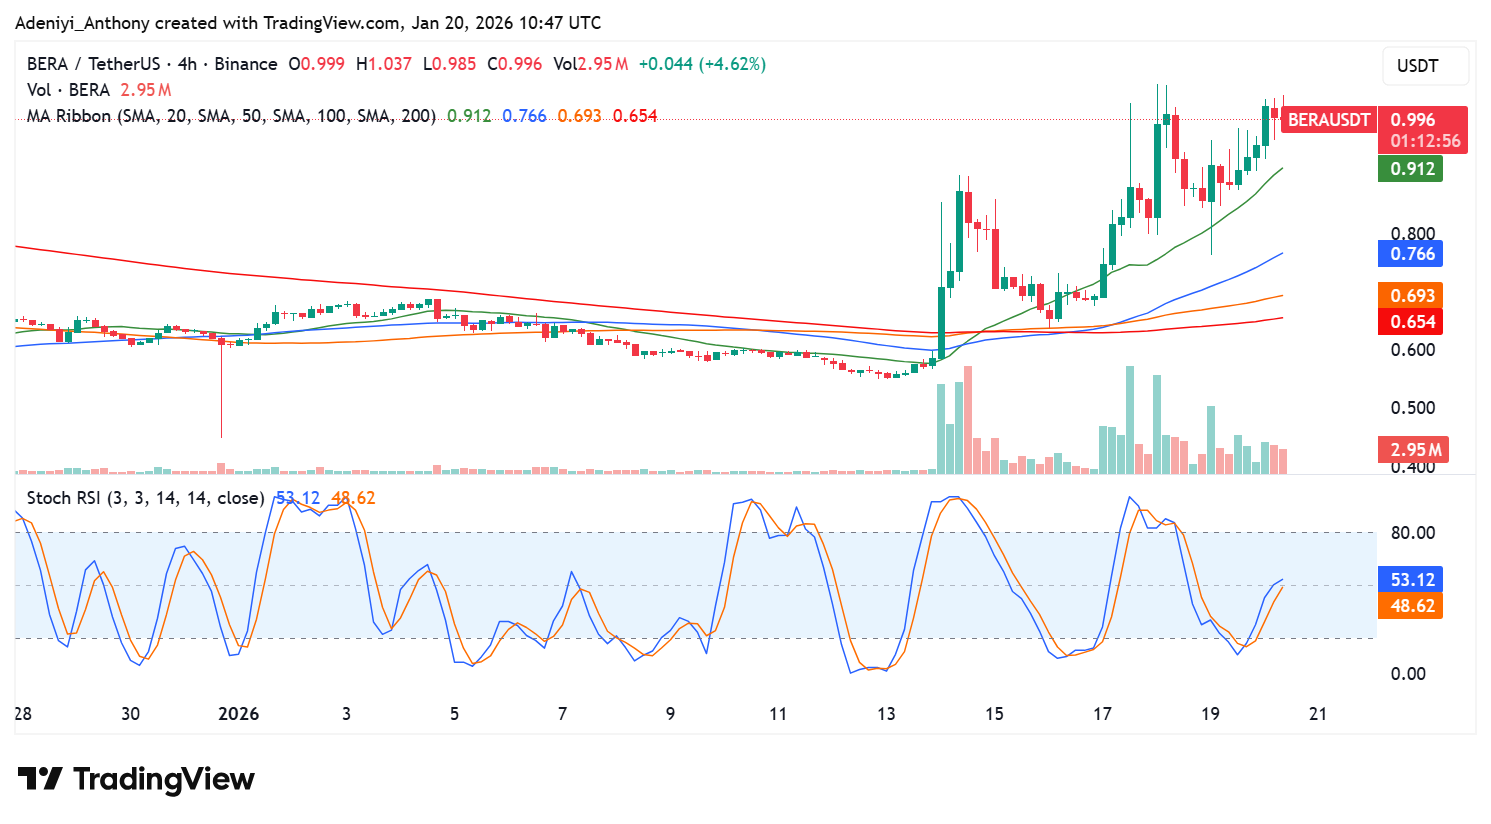
On the 4-hour chart, BERA/USDT seems to be cooling down as indicated by the momentum oscillator’s neutral stance. However, the price retains its position above the SMA. As it stands, the pair is heading toward $1.00. However, a move below $0.836 would invalidate this move, and a retracement towards $0.786 may unfold. To this end, though buying volume seems to have met an unexpected end, the sell-side volume for a reversal is not enough.
You can purchase crypto coins here. Buy Crypto